What is the ratio between the number of Margherita pizzas sold in third and fourth weeks, and the number of CHEESE N CORN pizzas sold in first and third weeks?
3:4
4:3
1:4
3:5
The correct Answer is:A
Step by step video, text & image solution for What is the ratio between the number of Margherita pizzas sold in third and fourth weeks, and the number of CHEESE N CORN pizzas sold in first and third weeks? by Maths experts to help you in doubts & scoring excellent marks in Class 14 exams.
Similar Questions
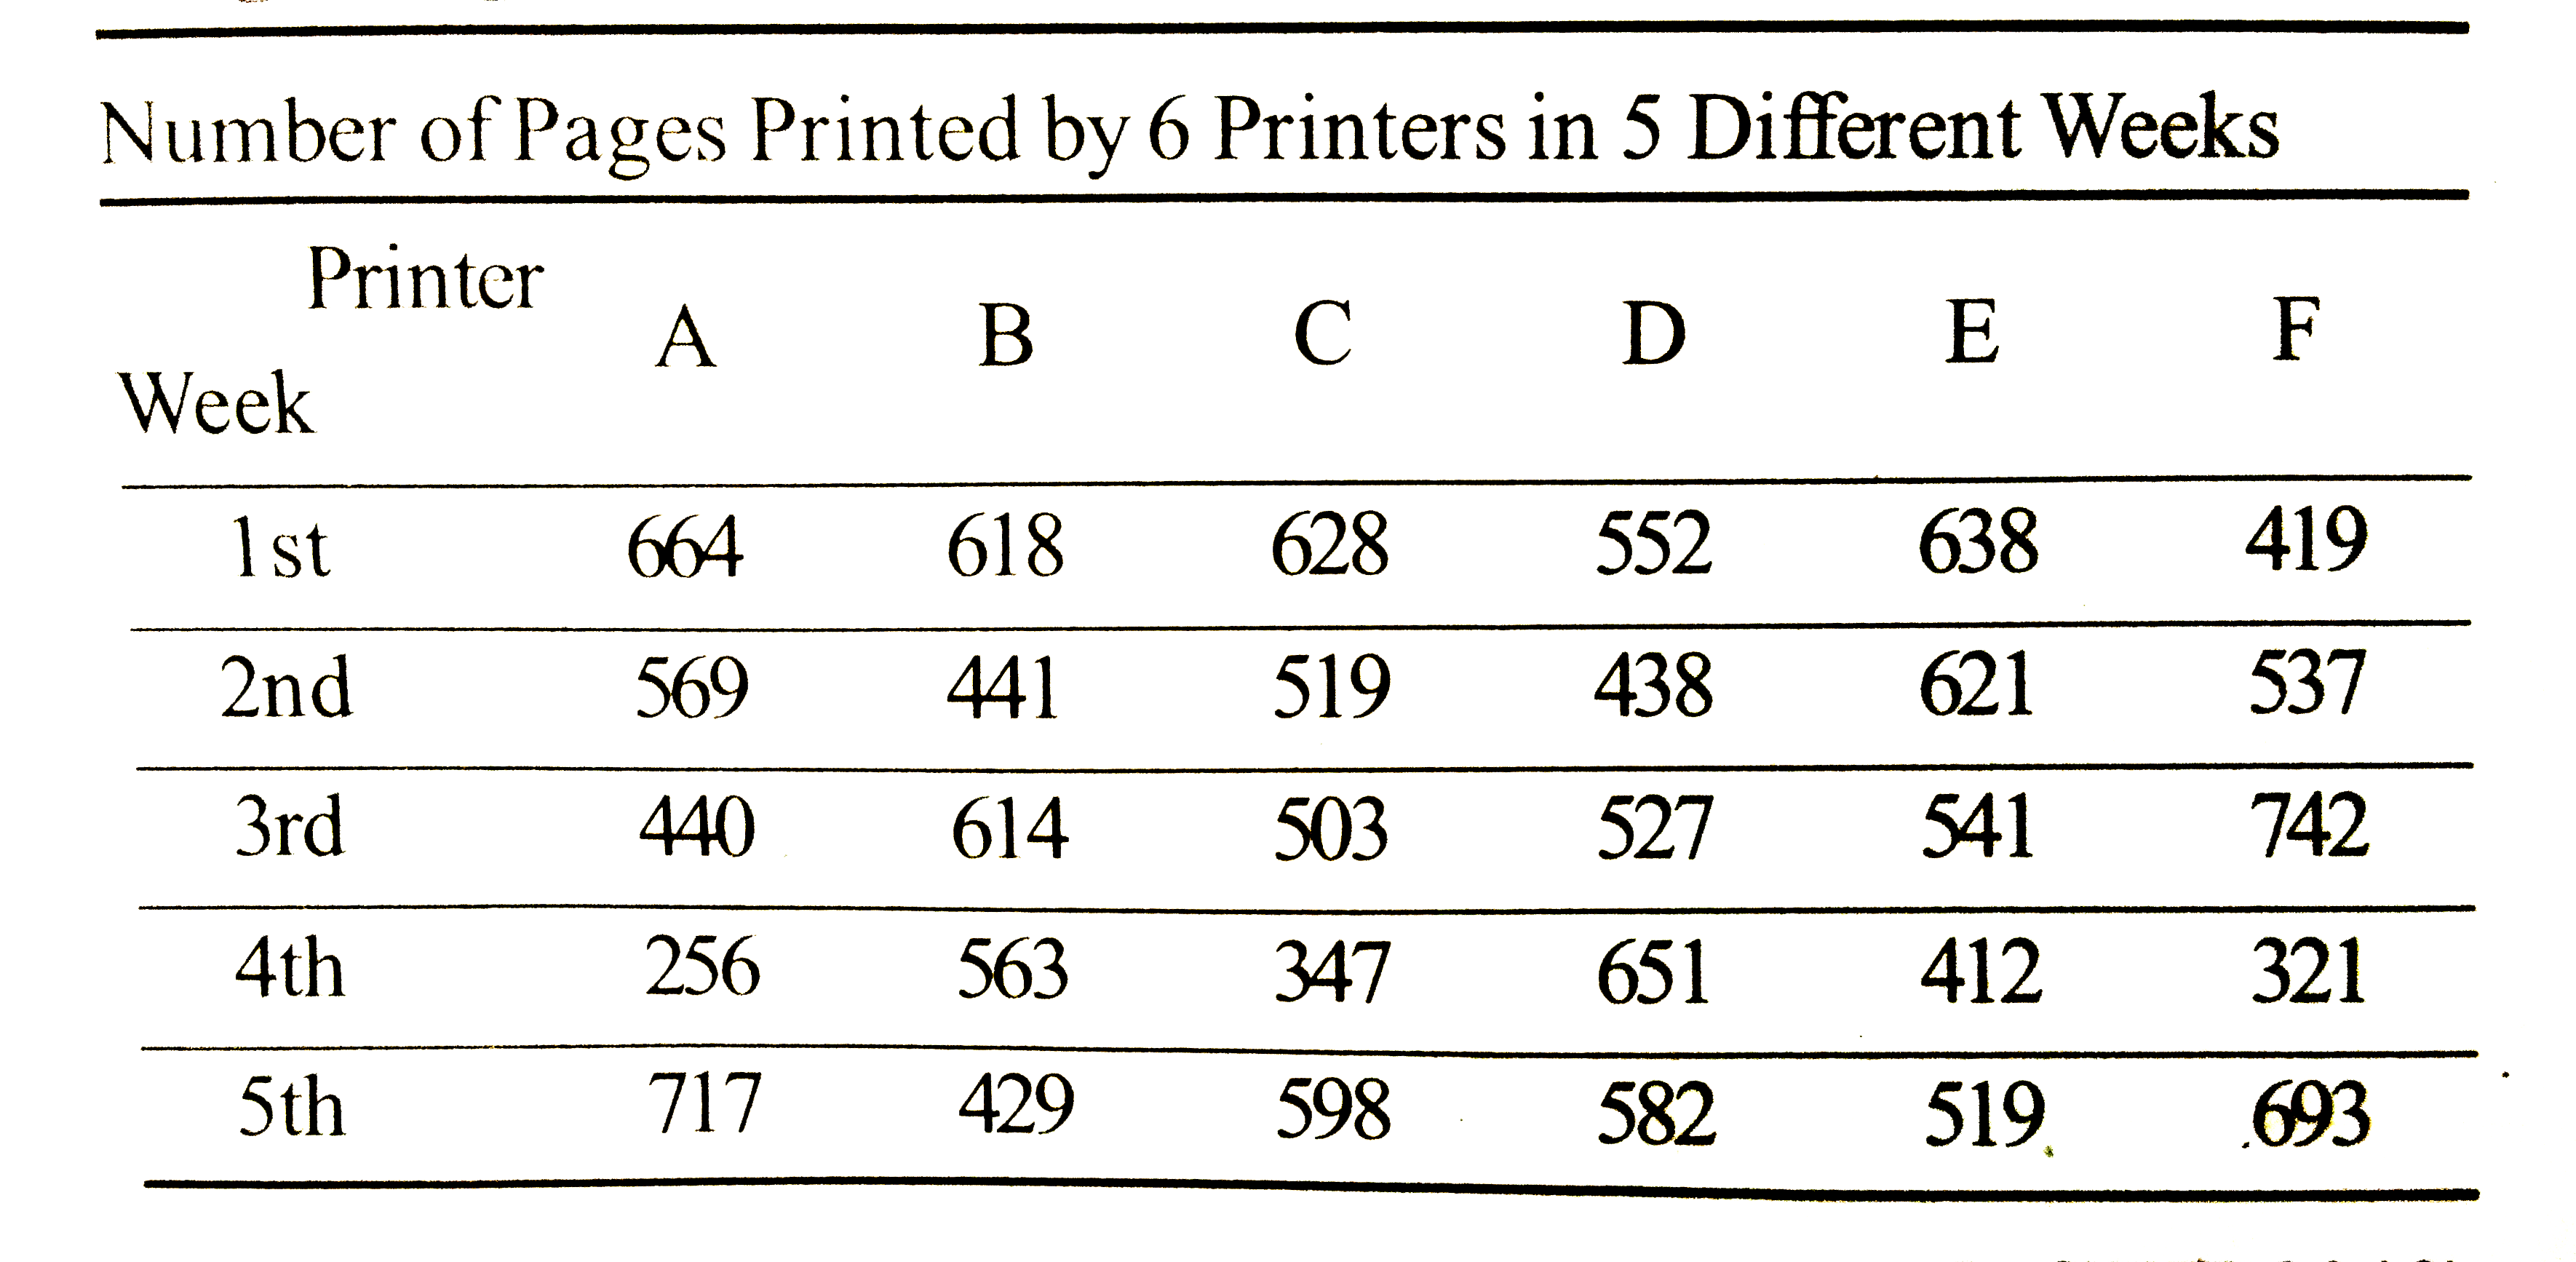
What is the respective ratio between the number of pages printed by Printer B in 2nd week and the number pages printed by Printer F in 5th week ?View Solution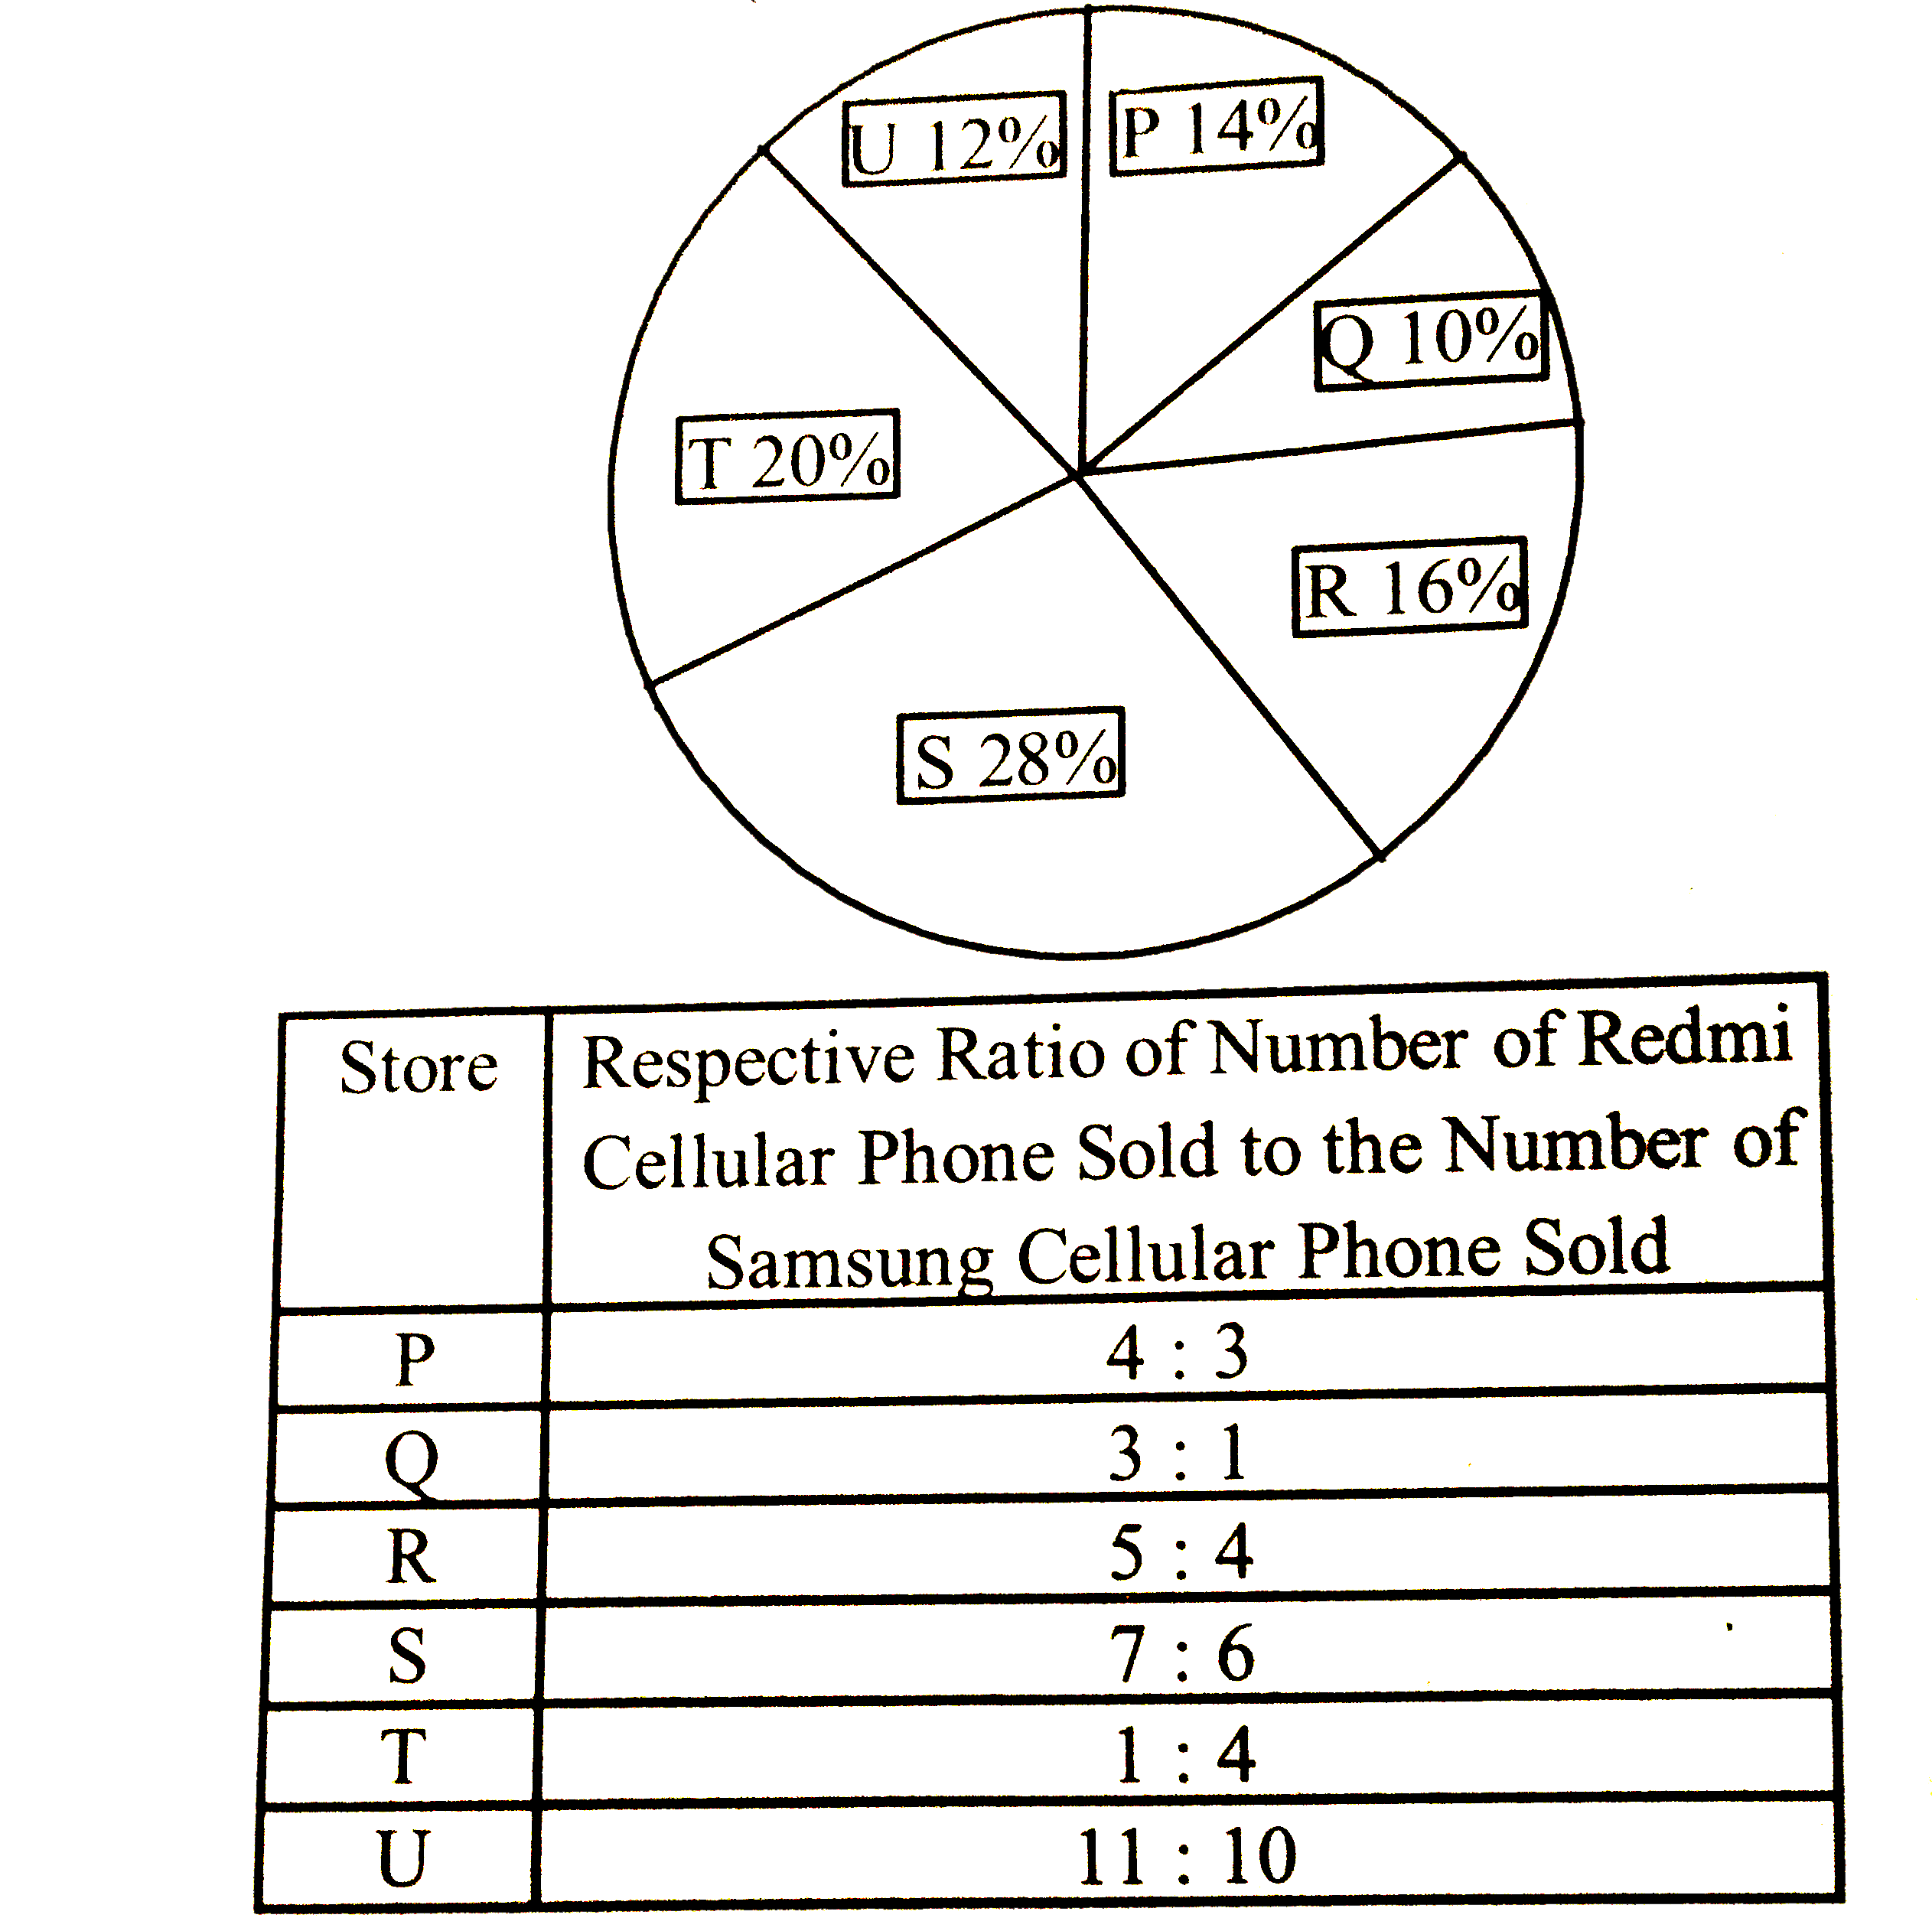
What is the respective ratio between number of Redmi cellular phones sold by stor S and total number of Samsung cellular phones sold by stores T and U together ?View Solution
Knowledge Check
- Question 1 - Select One
Study the given bar graph and answer the following questions accordingly.
The bar graph shows the three different types of pizzas sold by Pizza Hut in four different weeks.
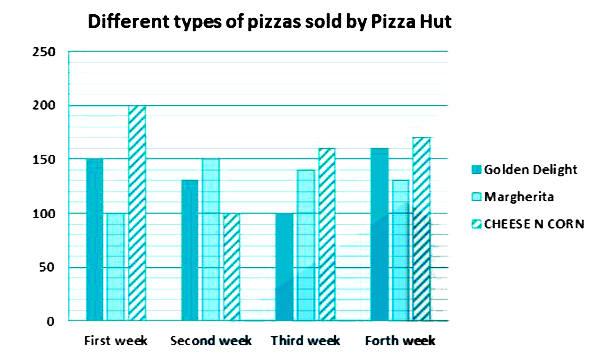
The number of Golden Delight pizzas sold in the first and second week is what percent more/less than the number of CHEES N CORN pizzas sold in the first and second week?A7.14% moreB6.66% lessC6.66% moreD7.14% less - Question 2 - Select One
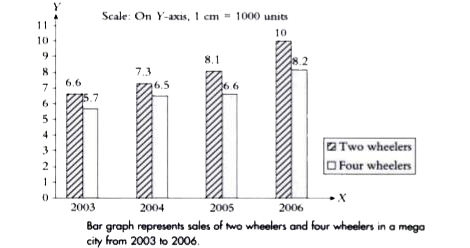
Find the ratio between number of vehicles sold in the year 2004 and in the year 2006.A41:46B69:91C147:182D46:49 - Question 3 - Select One
What is the difference between the number of tickets of movie D sold in Kolkata and the number of tickets of movie B sold in Lucknow?
A700B6000C14000D9000
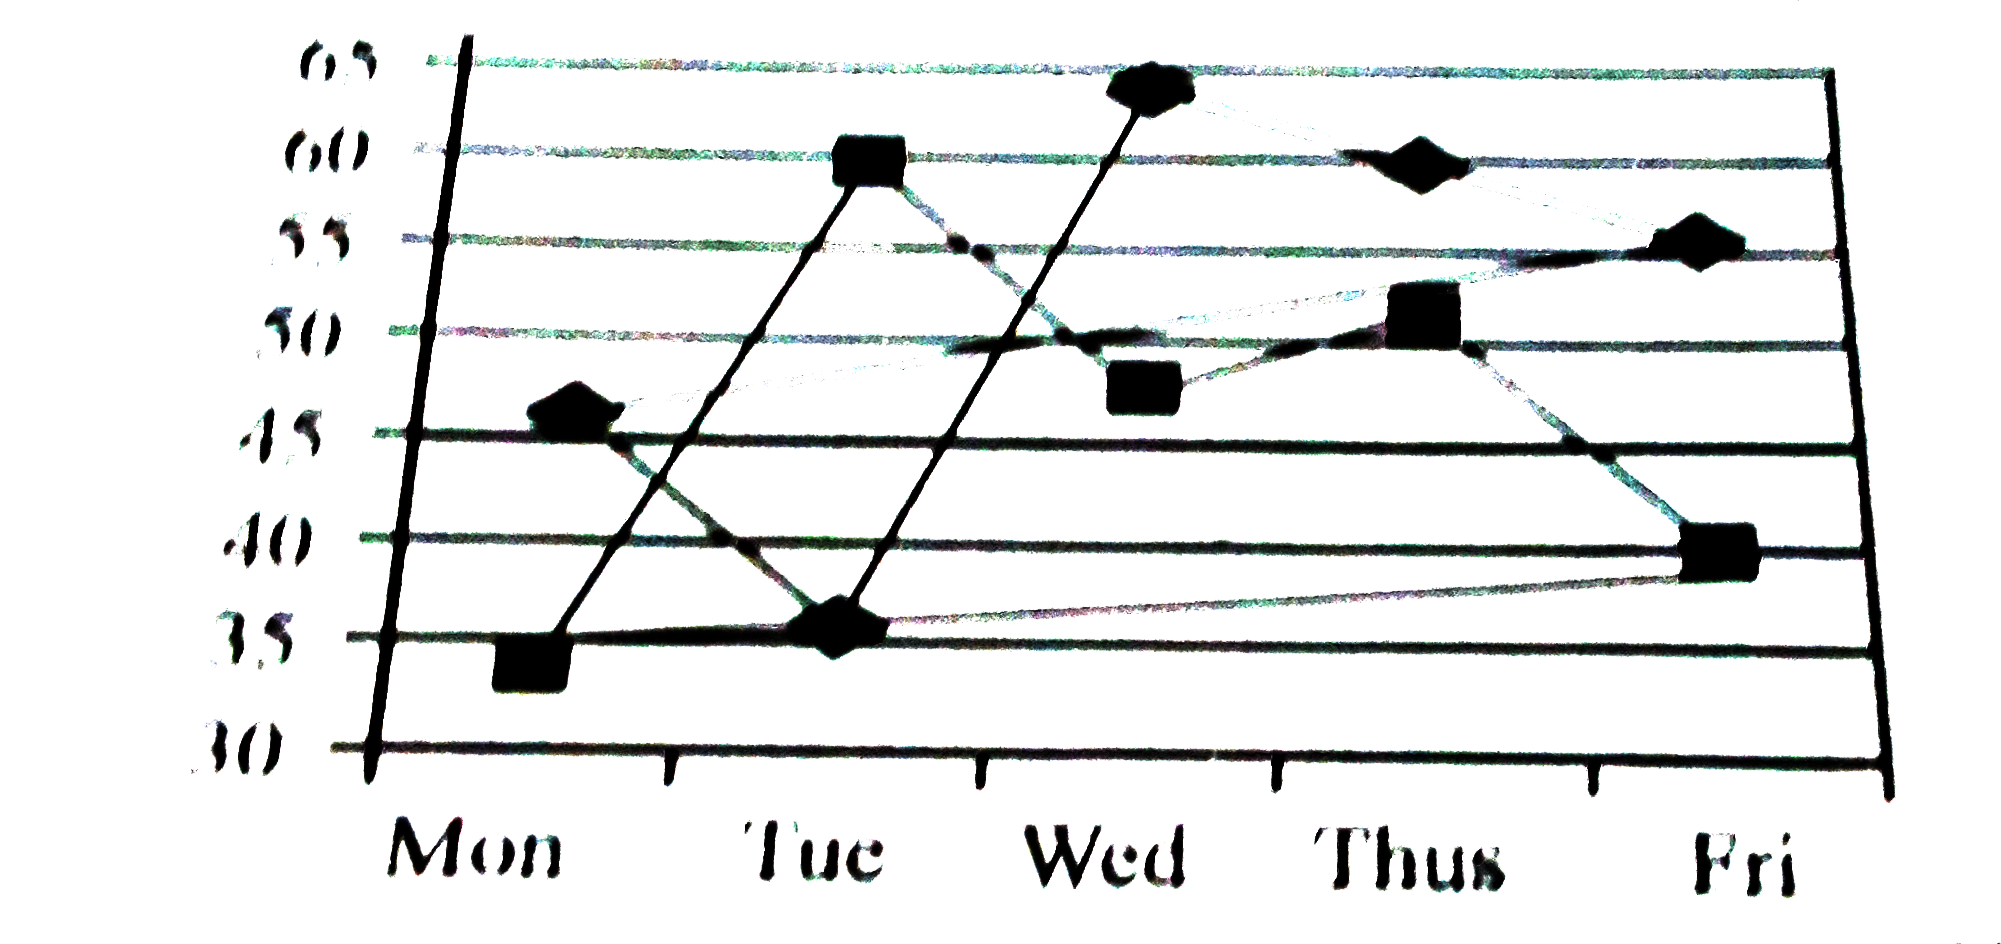
What is the difference between the number of mobiles sold on Monday and Wednesday by Q to the number of mobiles sold on Friday by both P & Q together ?View SolutionDirection: Study the data carefully and answer the following questions. Following is the data given of selling 2 types of pizza from 4 shops A, B, C and D.
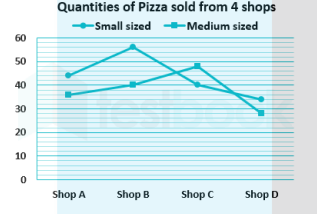
Find the difference between total number of small sized pizzas sold from shop A, B and D together and total number of pizza sold from Shop C together.View SolutionThe given pictograph shows the number of pizzas delivered by pizza hut during a week.
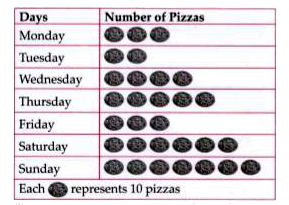
Find the number of pizzas delivered on Sunday.View Solution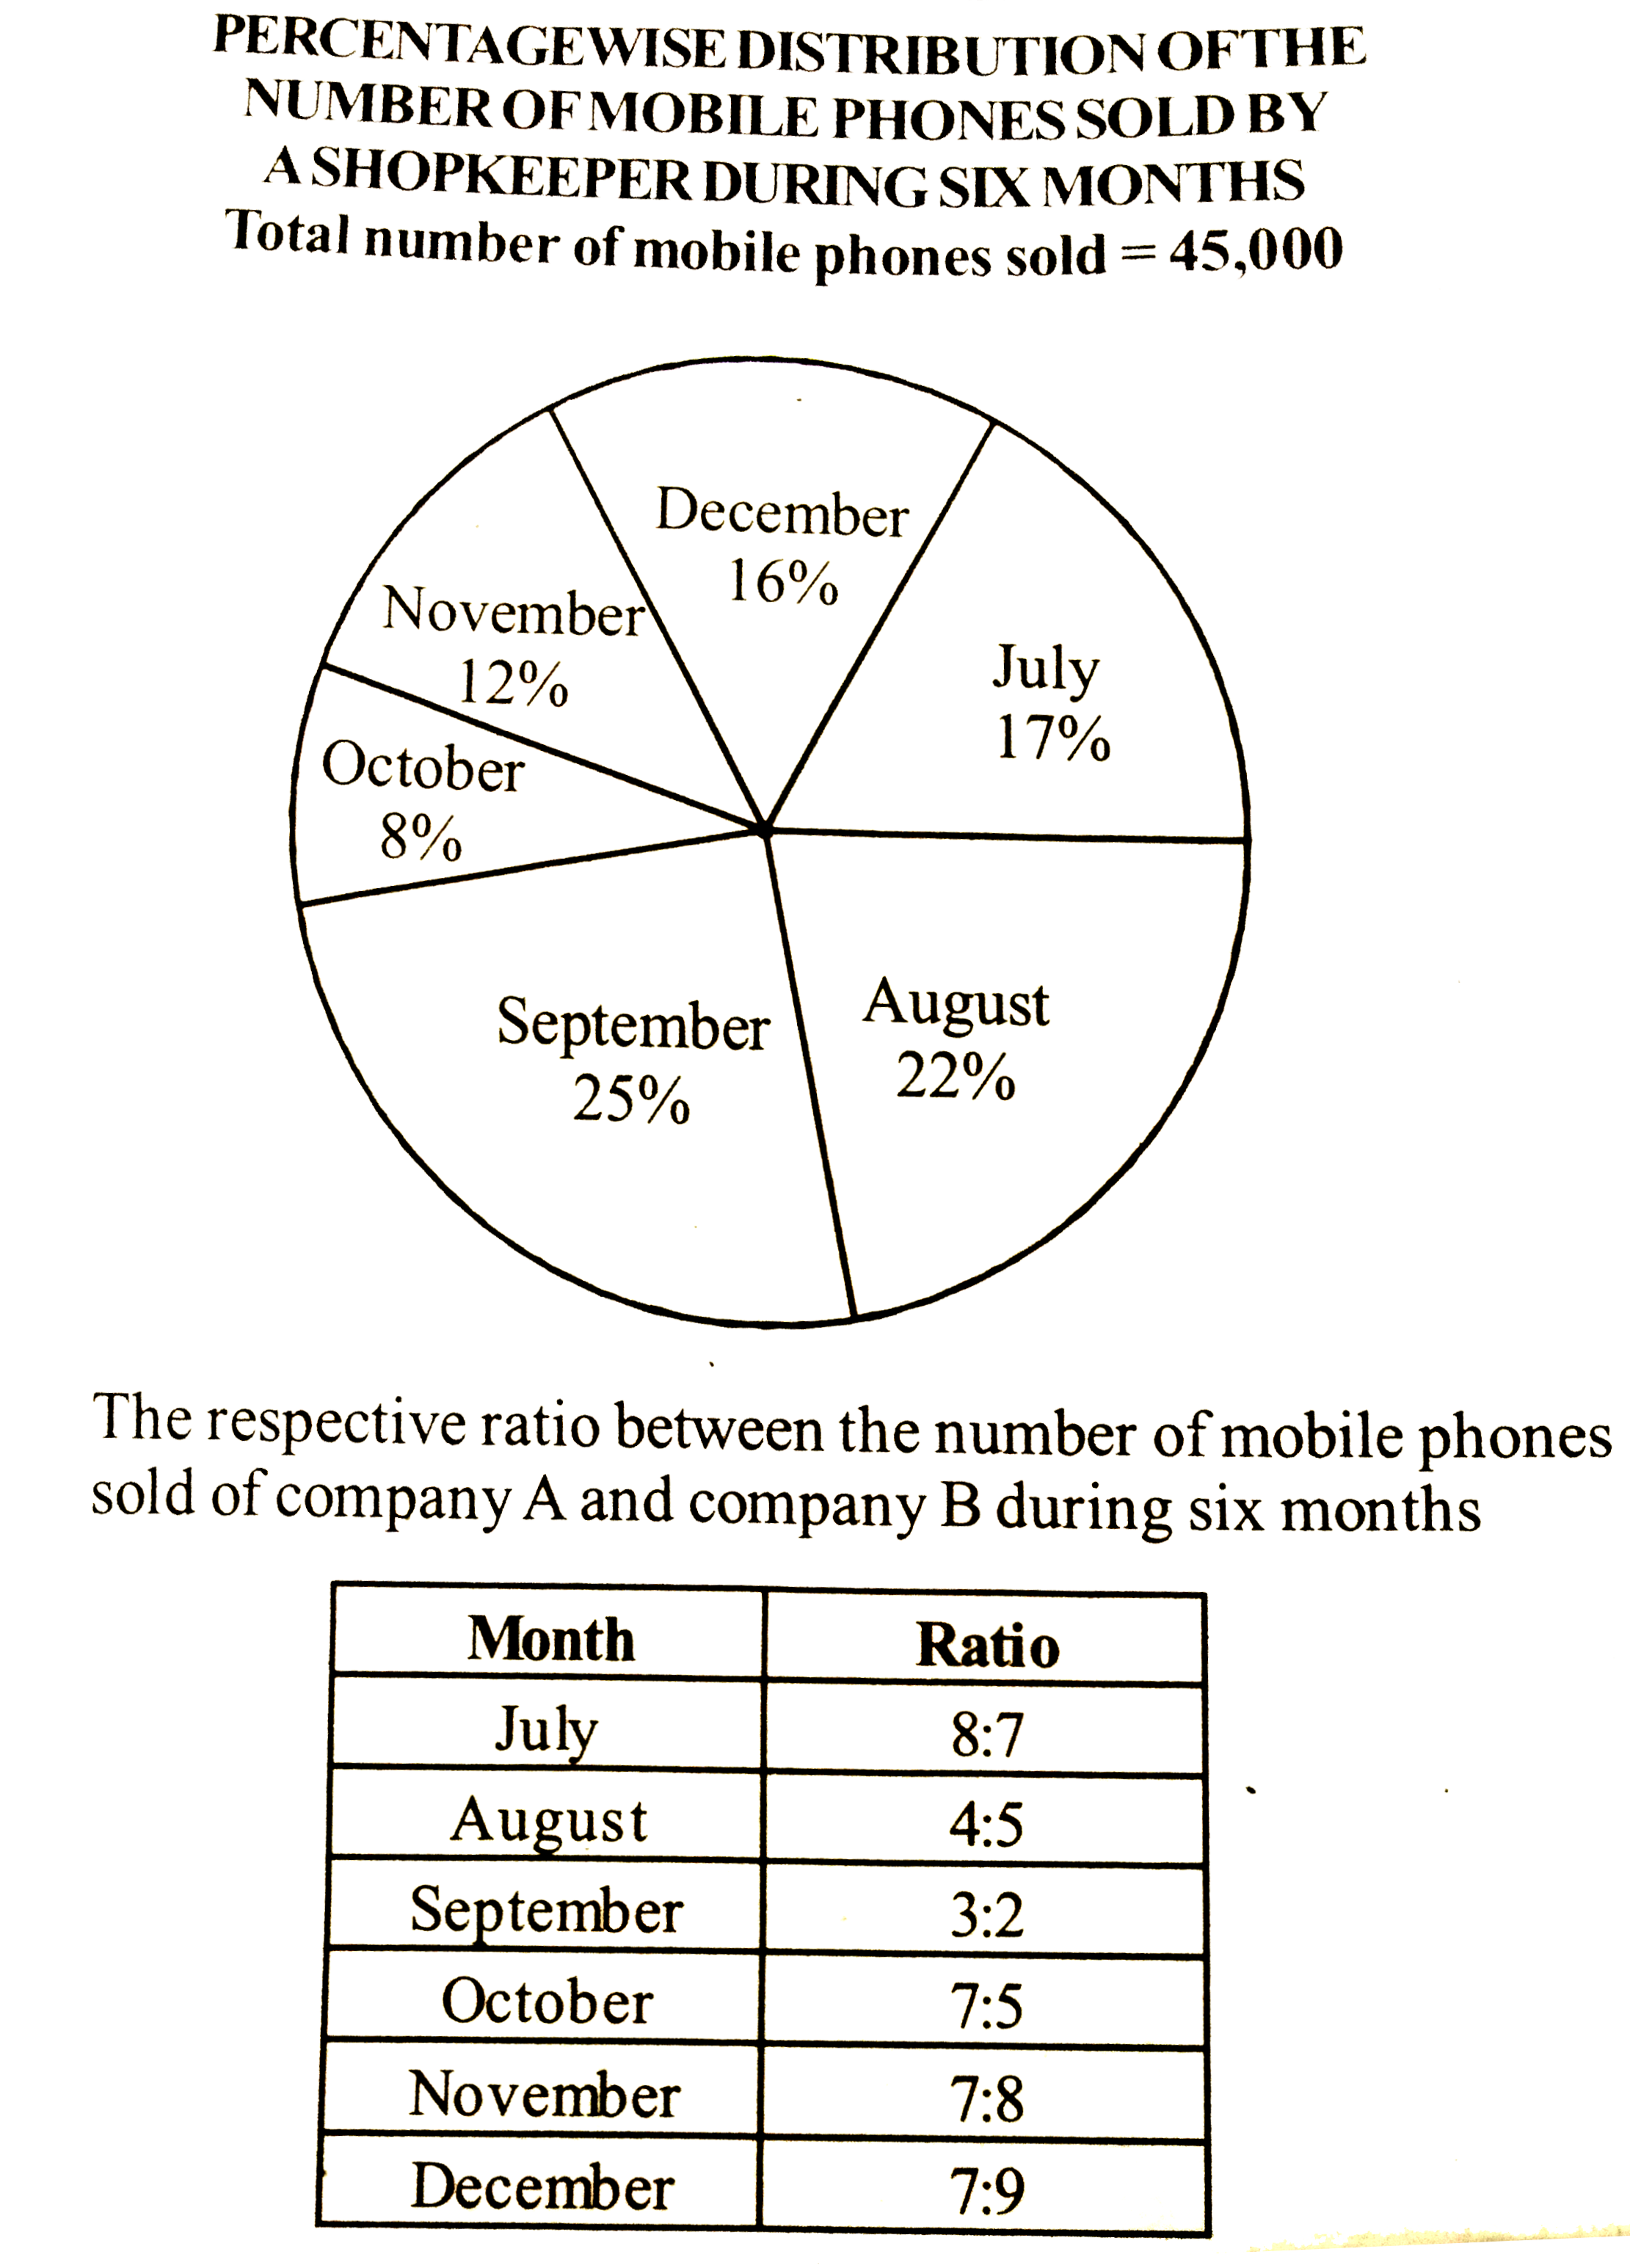
What is the respective ratio between the number of mobile phones sold of company B during July and thoses sold during December of the same company ?View SolutionThe given table represents the sale (in thousands) of cars by four companies A,B,C and D in six years. Study the table and answer the questions that follow:
दी गयी तालिका चार कंपनियों - A, B, C और D के द्वारा छः वर्षों में की गयी कारों की बिक्री ( हज़ार में ) दर्शाती है | इस तालिका का अध्ययन करें तथा फिर पूछे गए प्रश्नों के उत्तर दें |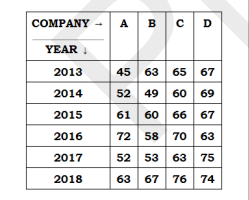 What is the ratio of total number of cars sold by companies A,B and D in 2017 to the total number
of cars sold by all companies in 2018?
कंपनी A, B और D के द्वारा 2017 में बेची गयी कारों की कुल संख्या तथा 2018 में सभी कंपनियों के द्वारा बेची गयी कारों की कुल संख्या के बीच क्या अनुपात है ?View Solution

