Direction: The following pie chart shows the percentage of production of books by different companies in a year. Read the chart and answers the following questions.
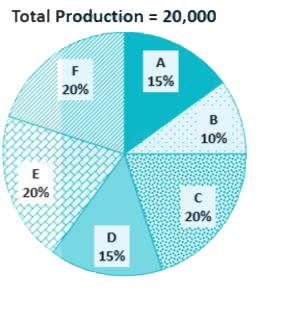
Find the average production of books by company B and C:
6000
3000
4000
5000
The correct Answer is:B
Step by step video, text & image solution for Direction: The following pie chart shows the percentage of production of books by different companies in a year. Read the chart and answers the following questions. Find the average production of books by company B and C: by Maths experts to help you in doubts & scoring excellent marks in Class 14 exams.
Similar Questions
The following Bar chart shows the sales of a company XYZ (in Rs Crore). Study the chart and answer the following questions.
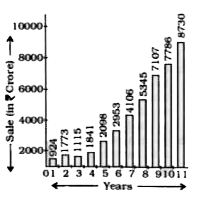
The 2nd highest sale in the year :View SolutionThe following Bar chart shows the sales of a company XYZ (in Rs Crore). Study the chart and answer the following questions.
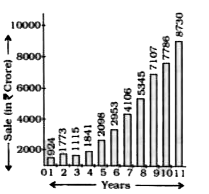
The 2nd least sale is in the year :View Solution
Knowledge Check
- Question 1 - Select One
The bar graph provided below gives the data of the production of paper (in lakh tonnes) by three different companies X, Y and Z over the years. Study the bar chart and answer the following questions.
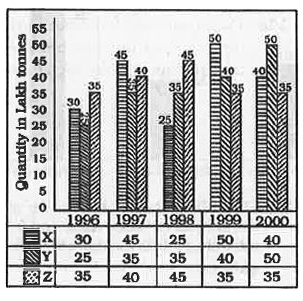
The percentage of production of company Z to the production of company Y is maximum in :A2000B1996C1999D1998 - Question 2 - Select One
The bar graph provided below gives the data of the production of paper (in lakh tonnes) by three different companies X, Y and Z over the years. Study the bar chart and answer the following questions.
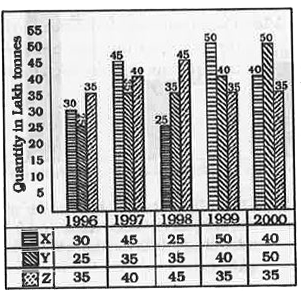
The average production for five years is maximum for which company?AX and ZBXCZDY - Question 3 - Select One
The following pie-chart shows the percentage distribution of the expenditure incurred in publishing a book. Read the pie-chart and answer the questions.
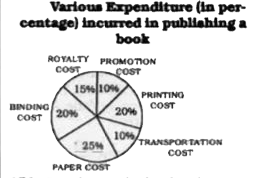
Royality on the book is less than the printing cost by :A20%B5%C25%D3313
Read the following graph carfully and answer the questions given below. Production of bulbs by different companies in three years (In lakhs)
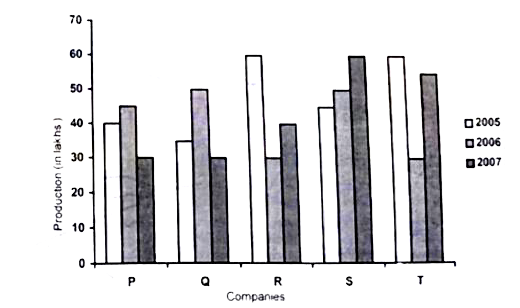
What is the ratio of average production of company Q to the average production of company T in all the given years?View SolutionThe bar graph provided below gives the data of the production of paper (in lakh tonnes) by three different companies X, Y and Z over the years. Study the bar chart and answer the following questions.
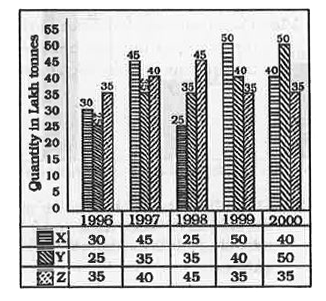
The difference between the production of company Z in 1998 and company Y in 1996 is :View SolutionThe following pie-chart shows the percentage distribution of the expenditure incurred in publishing a book. Read the pie-chart and answer the questions.
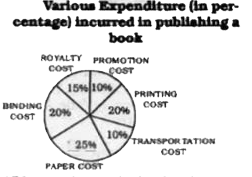
If 5500 copies are published and the transportation cost on them amount to Rs. 82500 then the selling price of the book so that the publisher can earn a profit of 25% is :View SolutionThe pie chart shows the breakup of expenditure of a mining company for the year 2017. Study the diagram and answer the following questions.
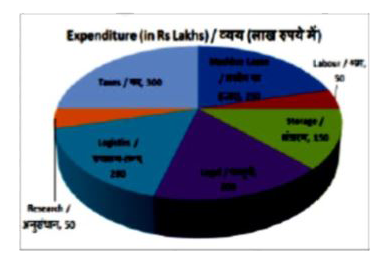
What is the total expenditure (in Rs lakhs)?View SolutionThe bar graph provided below gives the data of the production of paper (in lakh tonnes) by three different companies X, Y and Z over the years. Study the bar chart and answer the following questions.
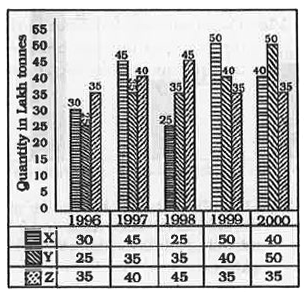
The percentage increase in the production of company Y from 1996 to 1999 is :View Solution

