The following pie chart shows the percentage of production books by different companies in a year.Read the chart and answer the following question
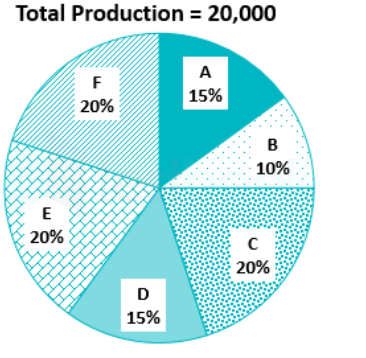
Total production of books by company E is what percent of total production of books by company B:
100%
50%
200%
0%
The correct Answer is:C
Step by step video, text & image solution for The following pie chart shows the percentage of production books by different companies in a year.Read the chart and answer the following question Total production of books by company E is what percent of total production of books by company B: by Maths experts to help you in doubts & scoring excellent marks in Class 14 exams.
Similar Questions
The following graph shows the demand and production of cotton by 5 companies A, B, C, D and E. Study the graph and answer question
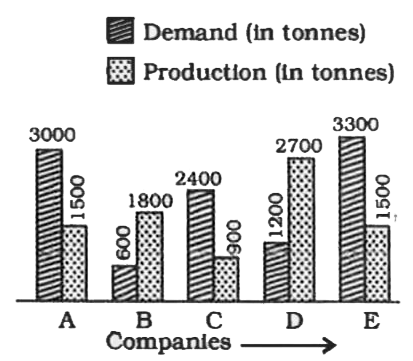
The production of company D is how many times that of the production of the company A?View SolutionRead the following graph carfully and answer the questions given below. Production of bulbs by different companies in three years (In lakhs)
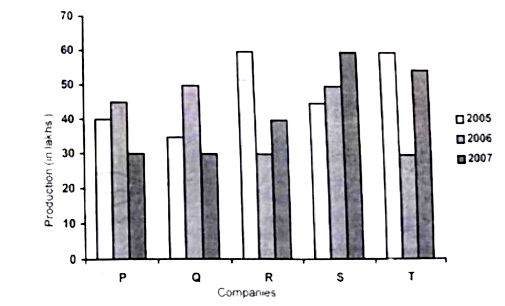
The total production of company P and Q in the year 2006 is approximately what percent of the total production of all companies in the year 2007 ?View Solution
Knowledge Check
- Question 1 - Select One
Direction: The following pie chart shows the percentage of production of books by different companies in a year. Read the chart and answers the following questions.
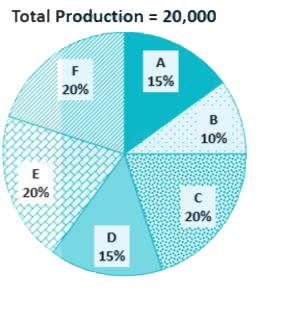
Find the average production of books by company B and C:A6000B3000C4000D5000 - Question 2 - Select One
The bar graph provided below gives the data of the production of paper (in lakh tonnes) by three different companies X, Y and Z over the years. Study the bar chart and answer the following questions.
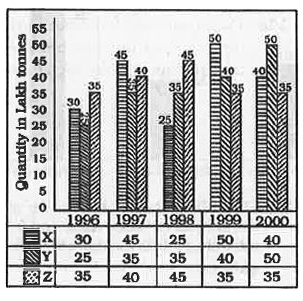
The percentage of production of company Z to the production of company Y is maximum in :A2000B1996C1999D1998 - Question 3 - Select One
The following pie-chart shows the percentage distribution of the expenditure incurred in publishing a book. Read the pie-chart and answer the questions.
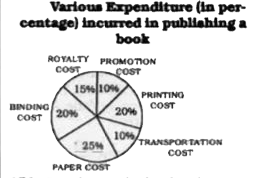
Royality on the book is less than the printing cost by :A20%B5%C25%D3313
Read the following graph carefully and answer the questions given below.
Production of sugar in three different factories over years (in thousand tonnes)
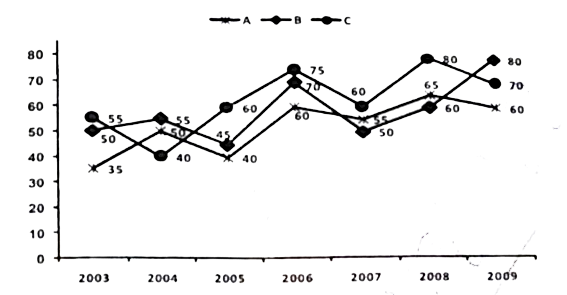
The total production of company B in 2004 and 2006 is what percent of total production of company C in 2006 and 2008 ?View SolutionThe pie chart shows the breakup of expenditure of a mining company for the year 2017. Study the diagram and answer the following questions.
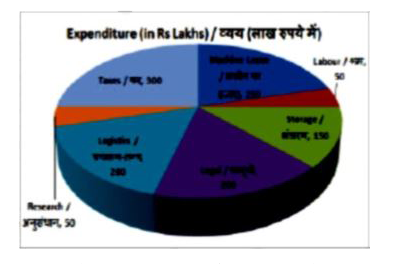
Expenditure on Labour and Research constitute what percent of total expenditure?View SolutionThe pie chart shows the break up of expenditure of a trading company for the year 2017. Study the diagram and answer th following questions.
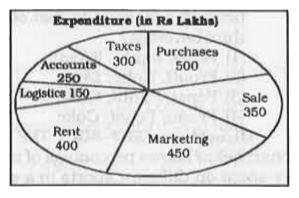
Expenditure on Sales and Marketing constitute what percent of total expenditure?View SolutionThe pie chart shows the breakup of expenditure of a software company for the year 2017. Study the diagram and answer the following questions.
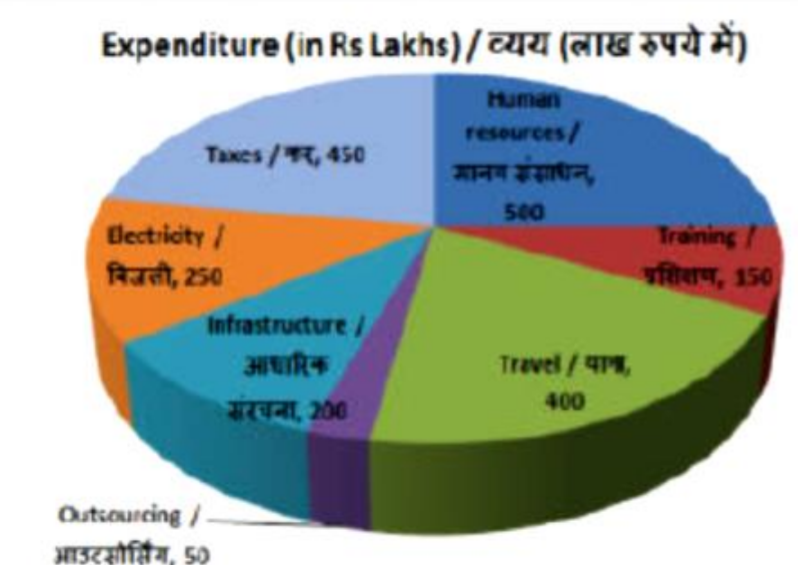
What is the total expenditure (in Rs lakhs)?View SolutionThe pie chart shows the breakup of expenditure of a mining company for the year 2017. Study the diagram and answer the following questions.
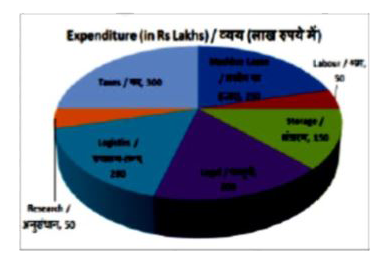
What is the total expenditure (in Rs lakhs)?View Solution

