The pie chart shows the breakup of expendoture of a manufacturing company for the year 2017. Study the diagram and answer the following questions.
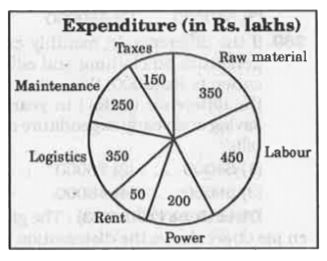
The measure of the central angle of the sector representing Taxes is ____ degrees.
40
20
60
30
The correct Answer is:D
Step by step video, text & image solution for The pie chart shows the breakup of expendoture of a manufacturing company for the year 2017. Study the diagram and answer the following questions. The measure of the central angle of the sector representing Taxes is ____ degrees. by Maths experts to help you in doubts & scoring excellent marks in Class 14 exams.
Updated on:21/07/2023Similar Questions
The pie chart shows the break up of expenditure of a trading company for the year 2017. Study the diagram and answer th following questions.
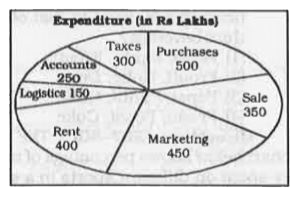
The measure of the central angle of the sector responding Rent is _____ degrees.
View SolutionThe pie chart shows the breakup of expenditure of a college for the year 2017. Study the diagram and answer the following questions.
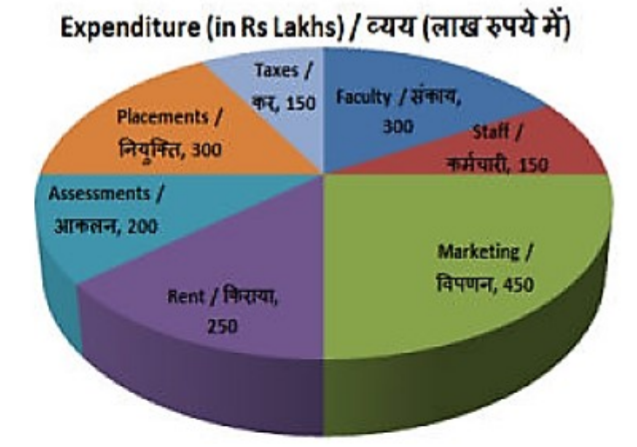
The measure of the central angle of the sector representing Faculty is ________ degrees.
View Solution
Knowledge Check
The pie chart shows the breakup of expendoture of a software company for the year 2017. Study the diagram and answer the following questions.
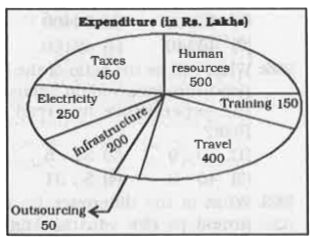
The measure of the central angle of the sector representing Taxes is ____ degrees.A27B30C33D24The pie chart shows the breakup of expenditure of a software company for the year 2017. Study the diagram and answer the following questions.
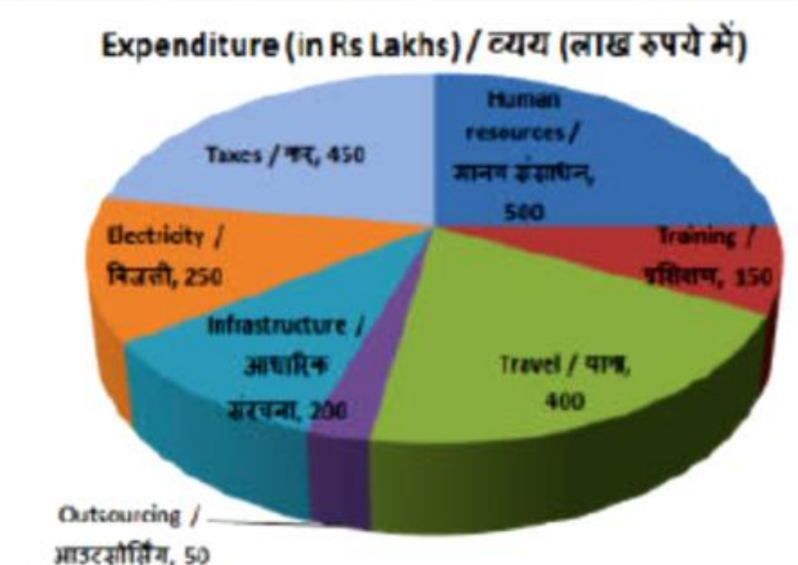
The measure of the central angle of the sector representing Training is _________ degrees.A27B30C33D24The pie chart shows the breakup of expenditure of a mining company for the year 2017. Study the diagram and answer the following questions.
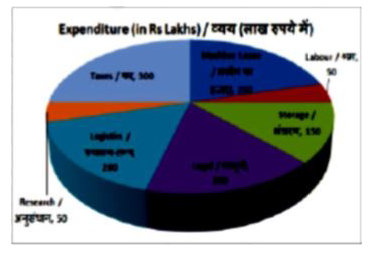
The measure of the central angle of the sector representing Machine Lease is ________ degrees.A70B75C80D90
The pie chart shows the breakup of expendoture of a manufacturing company for the year 2017. Study the diagram and answer the following questions.
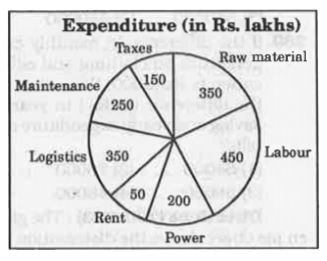
The second highest expenditure is for which item?
View SolutionThe pie chart shows the breakup of expendoture of a manufacturing company for the year 2017. Study the diagram and answer the following questions.
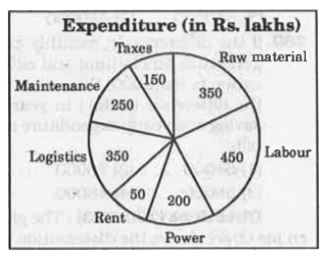
What is the total expenditure (in Rs. lakhs)?
View SolutionThe pie chart shows the breakup of expenditure of a manufacturing company for the year 2017. Study the diagram and answer the following questions.
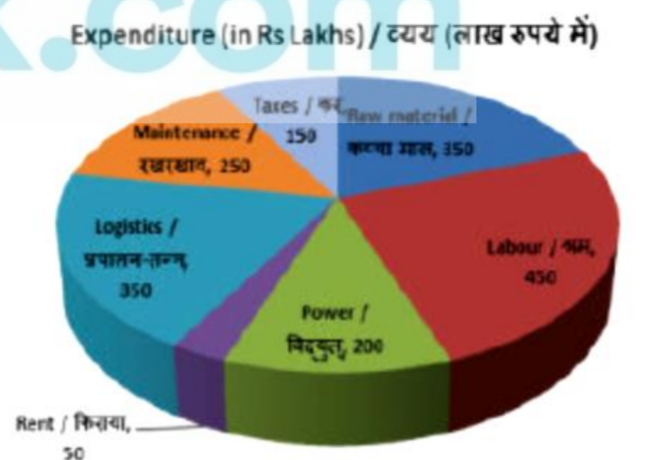
The second highest expenditure is for which item?
View SolutionThe pie chart shows the breakup of expenditure of a manufacturing company for the year 2017. Study the diagram and answer the following questions.
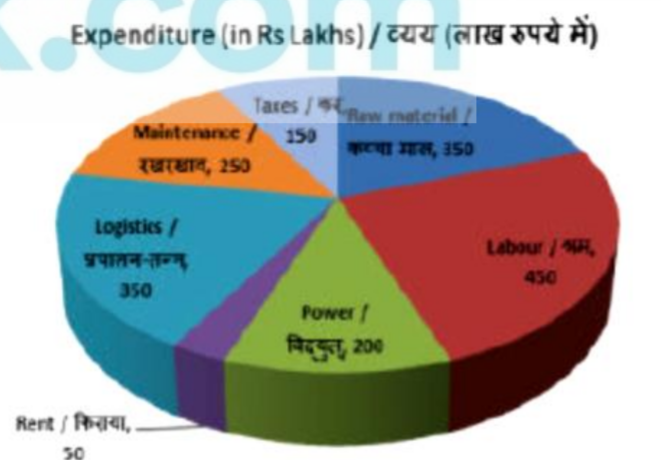
What is the total expenditure (in Rs lakhs)?
View SolutionThe pie chart shows the breakup of expendoture of a software company for the year 2017. Study the diagram and answer the following questions.
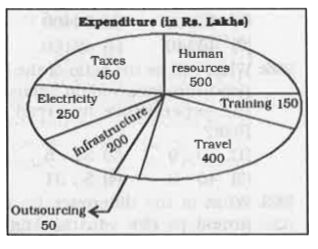
The second highest expenditure is for which item?
View Solution
