Find out the average of all the companies in the year 2020 (in thousand)?
78
80
82
84
The correct Answer is:C
To find the average sales of all the companies in the year 2020, we will follow these steps:
1. Identify Sales Data for Each Company in 2020:
- According to the video transcript, the sales figures for the companies in 2020 are as follows:
- Company 1 (C1): 80 (thousand)
- Company 2 (C2): 75 (thousand)
- Company 3 (C3): 95 (thousand)
- Company 4 (C4): 85 (thousand)
- Company 5 (C5): 75 (thousand)
2. Sum the Sales Data:
- Now, we will add the sales figures of all the companies:
Total Sales=C1+C2+C3+C4+C5=80+75+95+85+75
- Calculating the sum:
80+75=155
155+95=250
250+85=335
335+75=410
- Therefore, the total sales for all companies in 2020 is 410 thousand.
3. Calculate the Average:
- To find the average sales, we divide the total sales by the number of companies:
Average=Total SalesNumber of Companies=4105
- Performing the division:
4105=82
- Thus, the average sales of all companies in the year 2020 is 82 thousand.
Final Answer:
The average of all the companies in the year 2020 is 82 thousand.
---
- According to the video transcript, the sales figures for the companies in 2020 are as follows:
- Company 1 (C1): 80 (thousand)
- Company 2 (C2): 75 (thousand)
- Company 3 (C3): 95 (thousand)
- Company 4 (C4): 85 (thousand)
- Company 5 (C5): 75 (thousand)
- Now, we will add the sales figures of all the companies:
Total Sales=C1+C2+C3+C4+C5=80+75+95+85+75
- Calculating the sum:
80+75=155
155+95=250
250+85=335
335+75=410
- Therefore, the total sales for all companies in 2020 is 410 thousand.
- To find the average sales, we divide the total sales by the number of companies:
Average=Total SalesNumber of Companies=4105
- Performing the division:
4105=82
- Thus, the average sales of all companies in the year 2020 is 82 thousand.
The average of all the companies in the year 2020 is 82 thousand.
Similar Questions
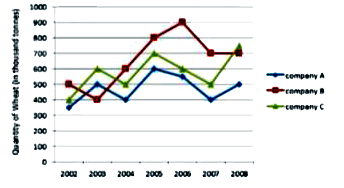
What is the average export of the company B for all the year ?
View SolutionStudy the following graph carefully to answer the questions given below. Expenditure in lakhs) of three different Companies in Five Different Years
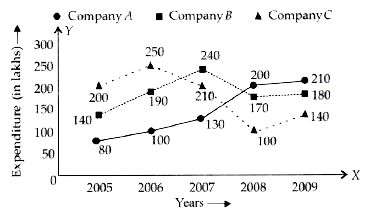
Total expenditure of all the three companies together in the year 2006 was what Percentage of the total expenditure of Company A over all the years together?
View Solution
Knowledge Check
In the following bar diagram sales of books (in thousand numbers) from six branches - B1, B2, B3, B4, B5 and B6 of a publishing company in 2009 and 2010 have been shown. Study the graph and answer the questions.
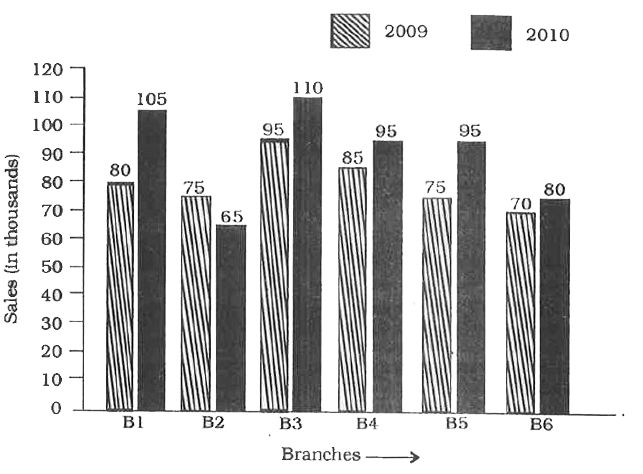
Total sales of branch B6 for both the years is x per cent of the total sales of branch B3 for both the years. The value of x isA73B83C80D88Find the average of pens sold in all years.
A46000B46700C45000D48400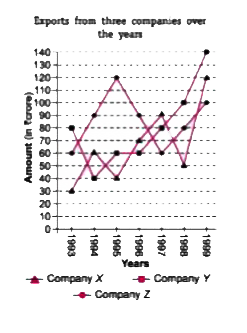
What was the difference between the average exports of the three companies in year 1993 and the aver- age exports in year 1998?A15.33 croreB18.67 croreC20 croreD22.17 crore
The pie-chart represents the profits earned by a certain company in seven consecutive years. Study the pie-chart carefully and answer the question.
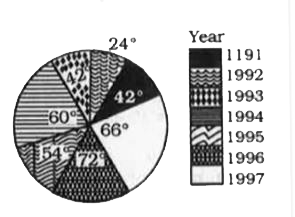
The year in which the profit is nearest to the average of the profits earned in all the given years is
View SolutionStudy the following graph which shows the production (in thousands)of different items, and answer these questions
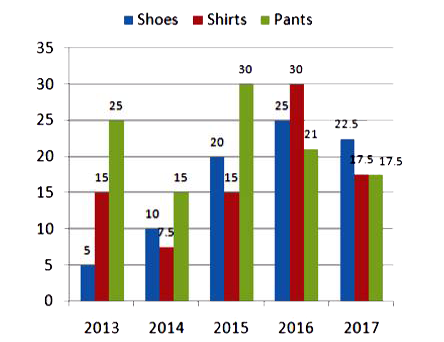
The difference between the total number of Shoes and Shirts produced by the company in the year 2016 and the number of Pants produced by the company in the year 2014 is:
View SolutionThere are two car manufacturing companies (Company X and Company Y). The sale of cars by these two different companies is given in different years.
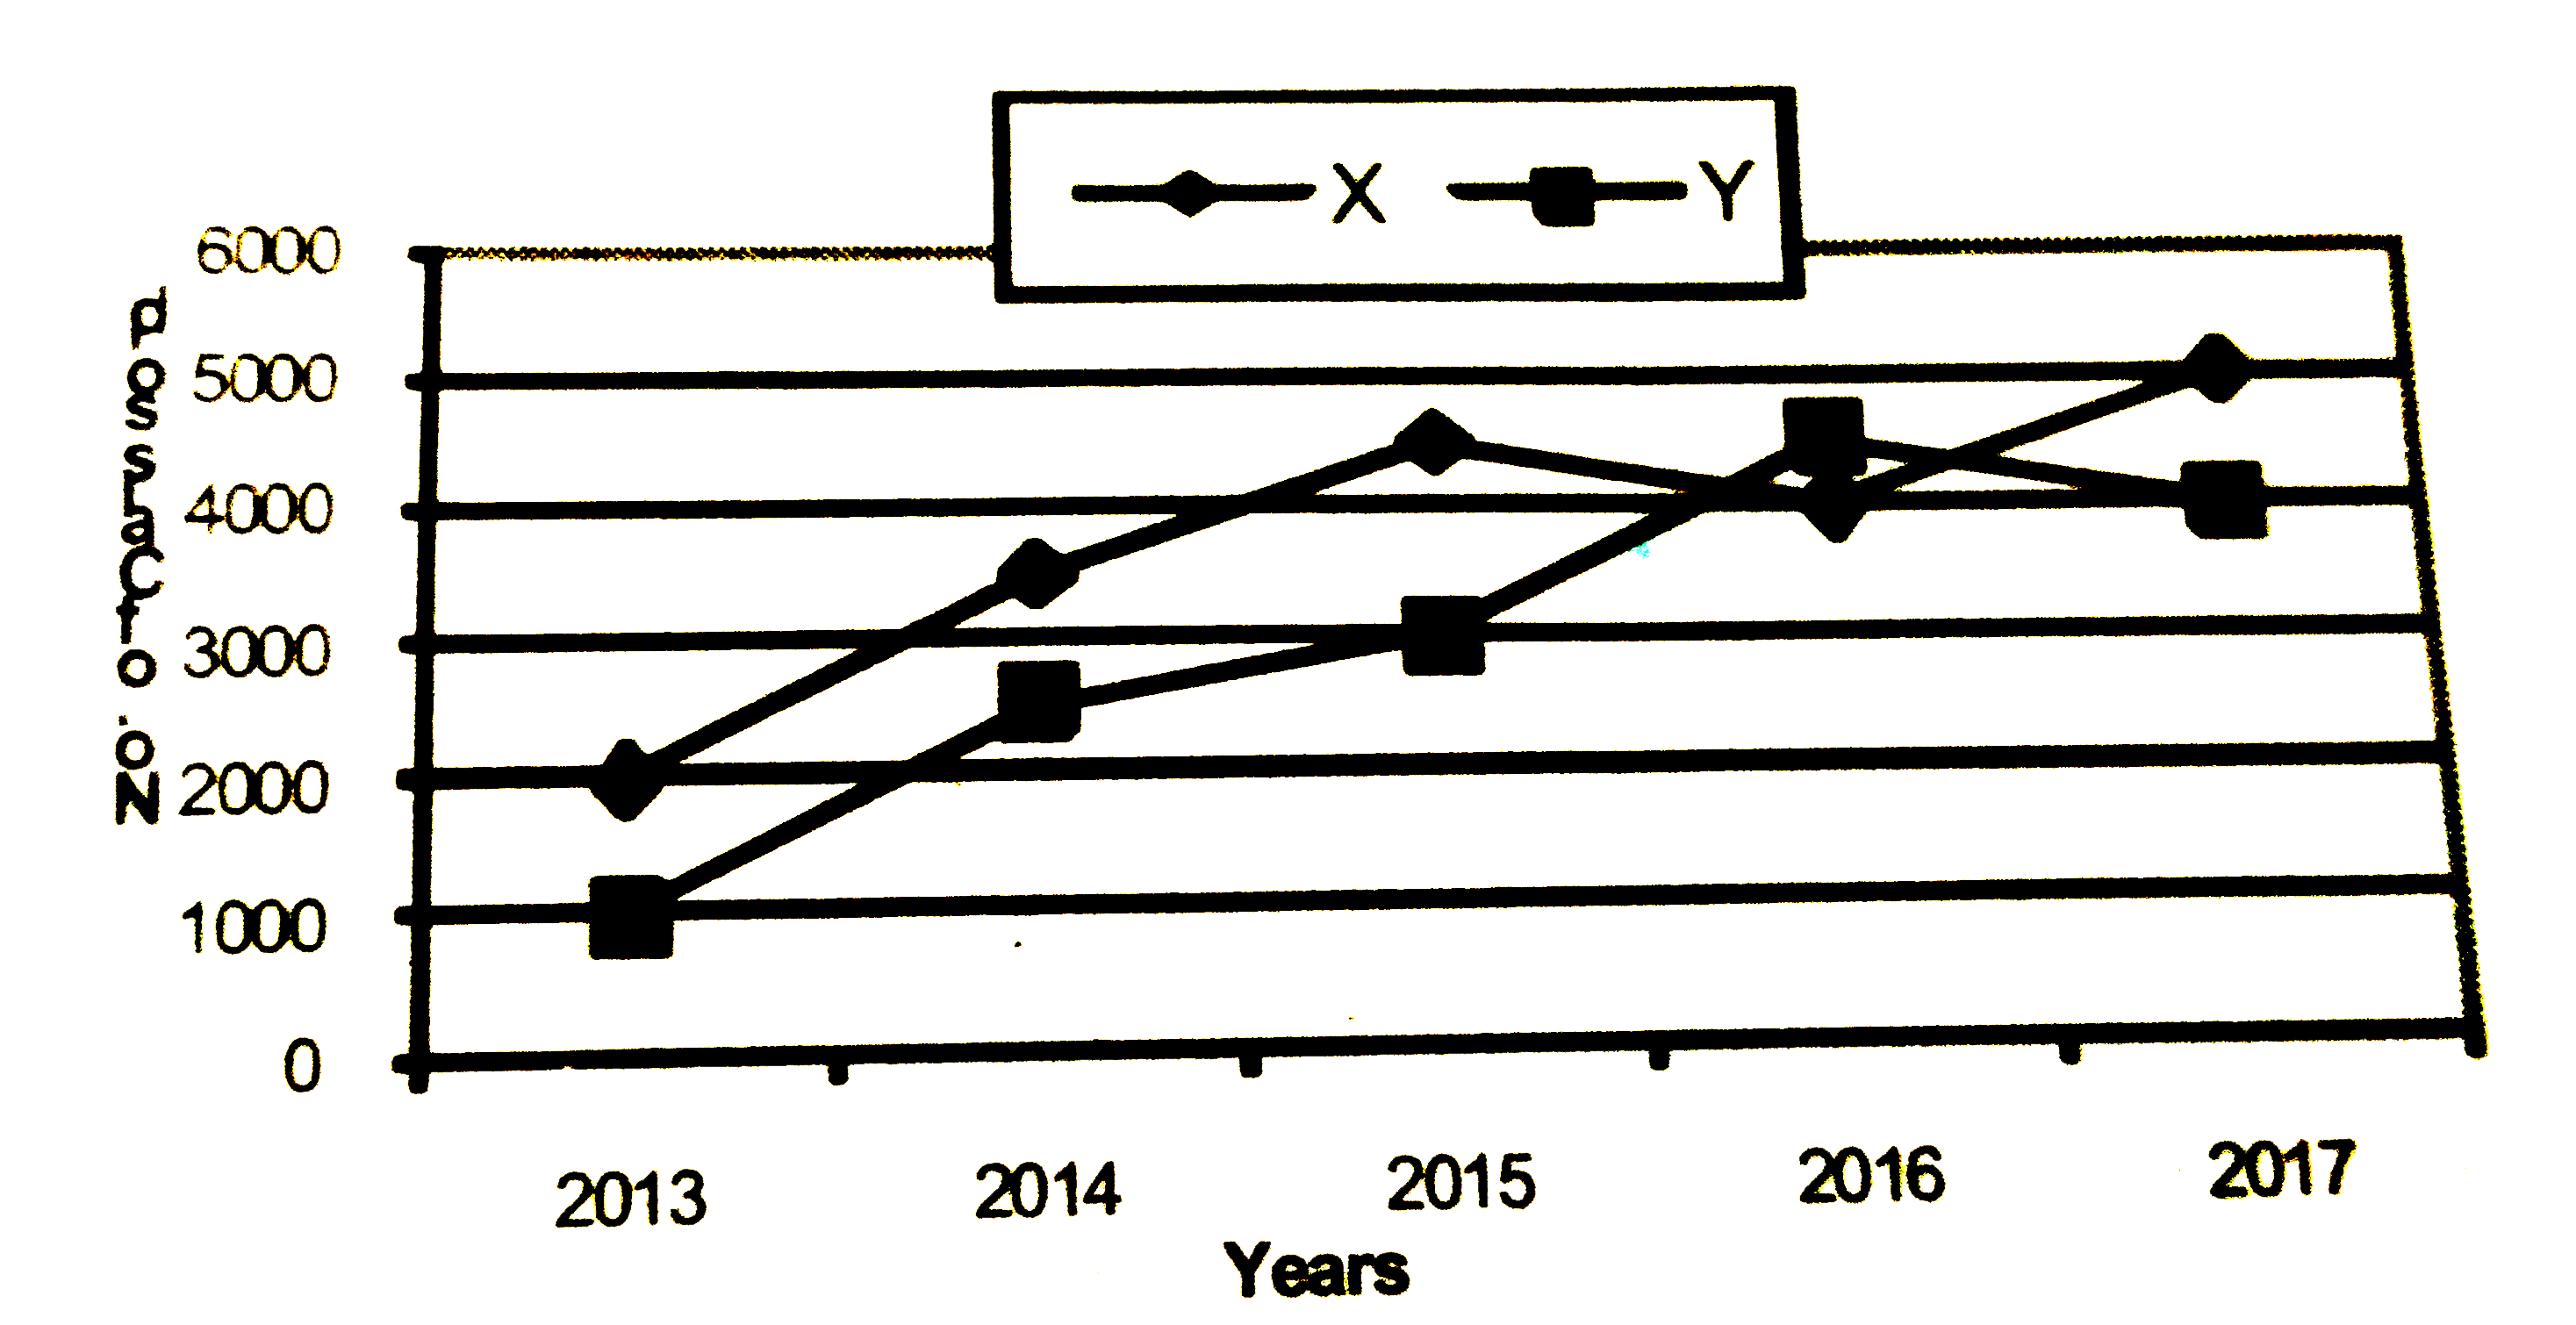
Find the ratio of the sales of company X in years 2013, 2015 and 2017 together to the total sale of company Y in year 2014 and 2016 ? together ?
View SolutionStudy the following graph which shows the production (in thousand) of different items, and answer the questions.
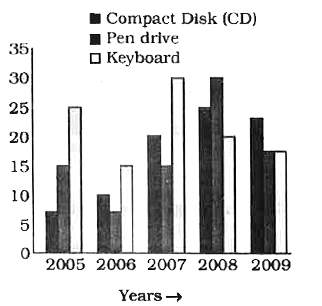
The respective ratio between the number of CDs produced by the company in the year 2009 and the number of kerbords produced by the company in the year 2005 is
View SolutionIn my office the average age of all the female employees is 21 years and that of male employees is 32 years, where the average age of all the (male and female) employees is 28 years. The total no. of employees in my office could be :
View Solution
