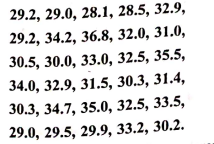
The daily maximum temperature of a city for a certain month is given in degree Celsius in the following data :
 By taking suitable classes, prepare the grouped frequency distribution table. From the table, answer the following question:
For how many days was the maximum temperature less than 34∘C?Solution in Marathi
Step by step video & image solution for The daily maximum temperature of a city for a certain month is given in degree Celsius in the following data : By taking suitable classes, prepare the grouped frequency distribution table. From the table, answer the following question: For how many days was the maximum temperature less than 34^@C? by Maths experts to help you in doubts & scoring excellent marks in Class 9 exams.
Updated on:21/07/2023Similar Questions
The inequation that best describes the graph given below is _________
View SolutionThe inequation that best describes the following graph is _________
View SolutionWhich inequations represent the shaded region in the given figure
View SolutionFrom the following figure, the correct observation is :- ltimg src="https://d10lpgp6xz60nq.cloudfront.net/physics_images/ALN_PHY_R03_E08_015_Q01.png" width="80%"gt
View SolutionThe monthly maximum temperature of a city is given in degree celcius in the following data. By taking suitable classes, prepare the grouped frequency distribution table 29.2, 29.0, 28.1, 28.5, 32.9, 29.2, 34.2, 36.8, 32.0,31.0, 30.5, 30.0, 33, 32.5, 35.5, 34.0, 32.9, 31.5, 30.3,31.4, 30.3, 34.7, 35.0, 32.5, 33.5, 29.0, 29.5, 29.9, 33.2, 30.2 From the table,answer the following questions. For how many days the maximum temperature was less than 34∘
View SolutionFrom the following figure, the correct observation is :-
ltimg src="https://d10lpgp6xz60nq.cloudfront.net/physics_images/ALN_PHY_R03_E08_015_Q01.png" width="80%"gt
View SolutionIdentify A,B,C and D,E
View SolutionConsider the following reactions.
View Solution
