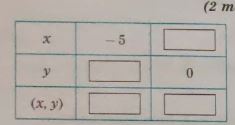
Complete the following table to draw the graph of the equations 2x−6y=3 :
 Solution in Marathi
Step by step video & image solution for Complete the following table to draw the graph of the equations 2x-6y=3 : by Maths experts to help you in doubts & scoring excellent marks in Class 10 exams.
Updated on:21/07/2023Topper's Solved these Questions
- LINEAR EQUATIONS IN TWO VARIABLESBOOK - NAVNEET PUBLICATIONCHAPTER - LINEAR EQUATIONS IN TWO VARIABLESEXERCISE - EXERCISE
93 Videos
- FINANCIAL PLANNINGBOOK - NAVNEET PUBLICATIONCHAPTER - FINANCIAL PLANNINGEXERCISE - EXERCISE
45 Videos
- PROBABILITYBOOK - NAVNEET PUBLICATIONCHAPTER - PROBABILITYEXERCISE - EXERCISE
78 Videos
Similar Questions
Draw the graph of x+y=6 which intersects the X-axis and Y-axis at A and B respectively. On the same graph paper, draw the graph of 2x-y=3 which intersects the X-axis and Y-axis at C and D respectively. E is the point of intersection of both the graphs. Find the areas of
/_\ ECA
/_\ EBD.
View SolutionThe market value of a mutual fund is Rs 400 crore, which is divided into 8 crore units.
Suppose you invest Rs 10,000 in the units, how many units will you get?
View SolutionThere are 5 red and 3 green pens in a bag . There are 2 red and 6 green pens in another bag. A pen is picked up at random from one bag. Using the following instructions, find the probability that the pen picked up:
From one bag is red.
View SolutionHow many lines of symmetry does the above figure have ?
View SolutionWhich of the following are correct chain isomers of butane ? (i)
View SolutionDetermine the point of symmetry of a regular hexagon.
View SolutionDtermine the images of the following figure about the given line :
View SolutionDraw the bisector of ∠AOB=58∘
ltimg src="https://d10lpgp6xz60nq.cloudfront.net/physics_images/PS_MATH_VII_C05_S01_009_Q01.png" width="80%"gt
View SolutionMatch the following Column A to Column B

View SolutionMatch the following Column A to Column B

View SolutionMatch the following Column A to Column B

View SolutionThe inequation represented by the graph given below is :
View SolutionThe inequation that best describes the graph given below is _________
View SolutionThe inequation that best describes the following graph is _________
View SolutionWhich inequations represent the shaded region in the given figure
View SolutionThe equation of straight line shown in figure is :
ltimg src="https://d10lpgp6xz60nq.cloudfront.net/physics_images/ALN_PHY_R04_E01_020_Q01.png" width="80%"gt
View Solution
