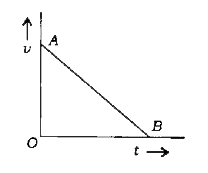
The velocity- time (v−t) graph shown above illustrates
uniform acceleraion of an object
Uniform retardation of an object
( non - uniform acceleration of an object
non - uniform retardation of an abject
Step by step video & image solution for The velocity- time (v-t) graph shown above illustrates by General Knowledge experts to help you in doubts & scoring excellent marks in Class 14 exams.
Updated on:21/07/2023Similar Questions
Knowledge Check
The velocity-time (v – t) graph of a body is shown in the figure. For the intervals OP and PQ, the ratio of the distances covered is
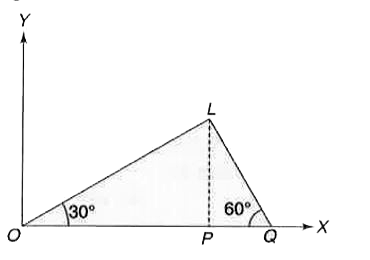 A1:3B√3:1C3:1D√3:2
Figure shows the displacement tiime (x-t) graph of a body moving in a straight line which one of the graph shown in figure represents the velocity- time (v-t) graph of the motion of the body.A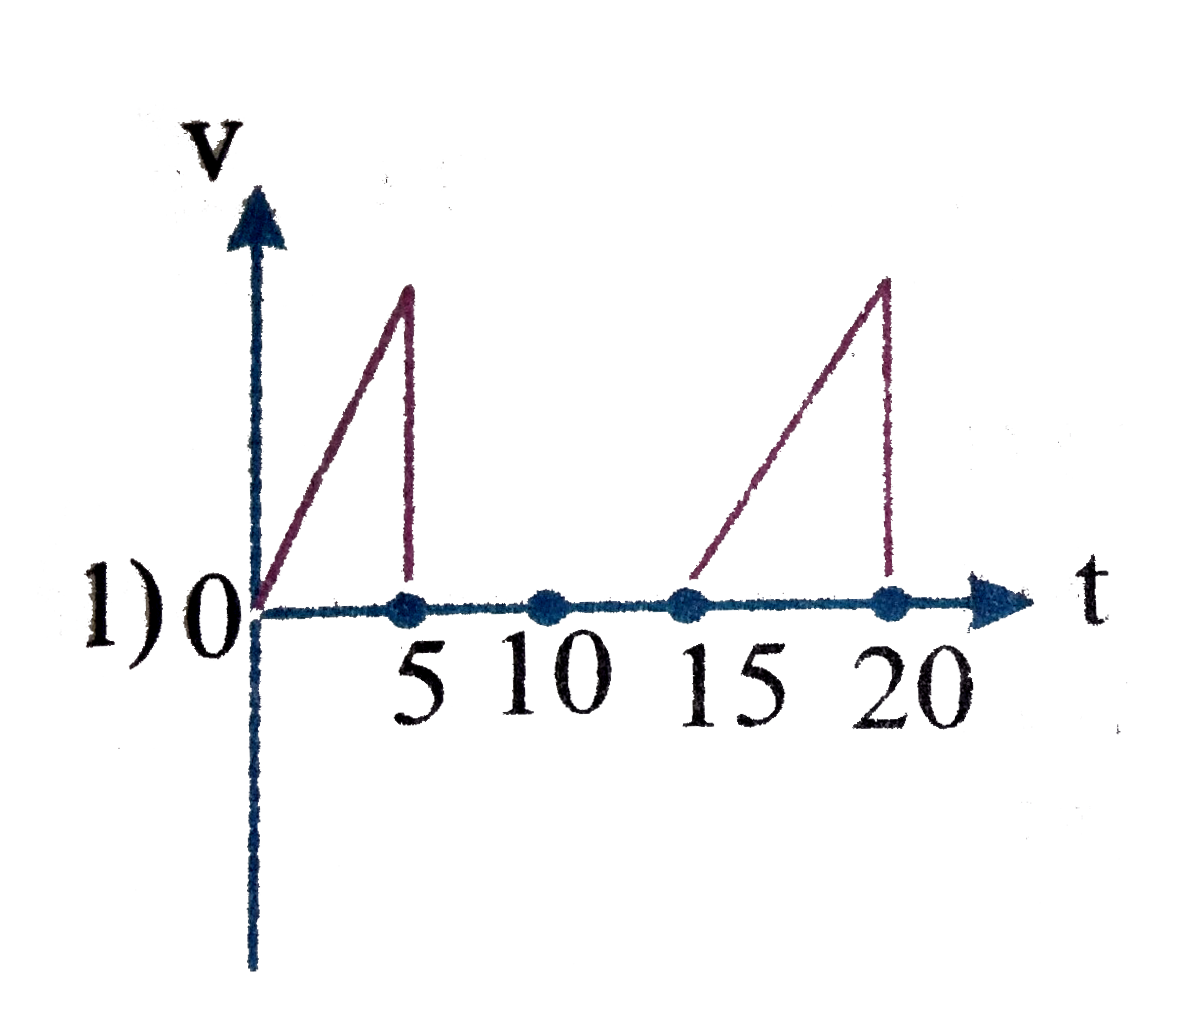 B
B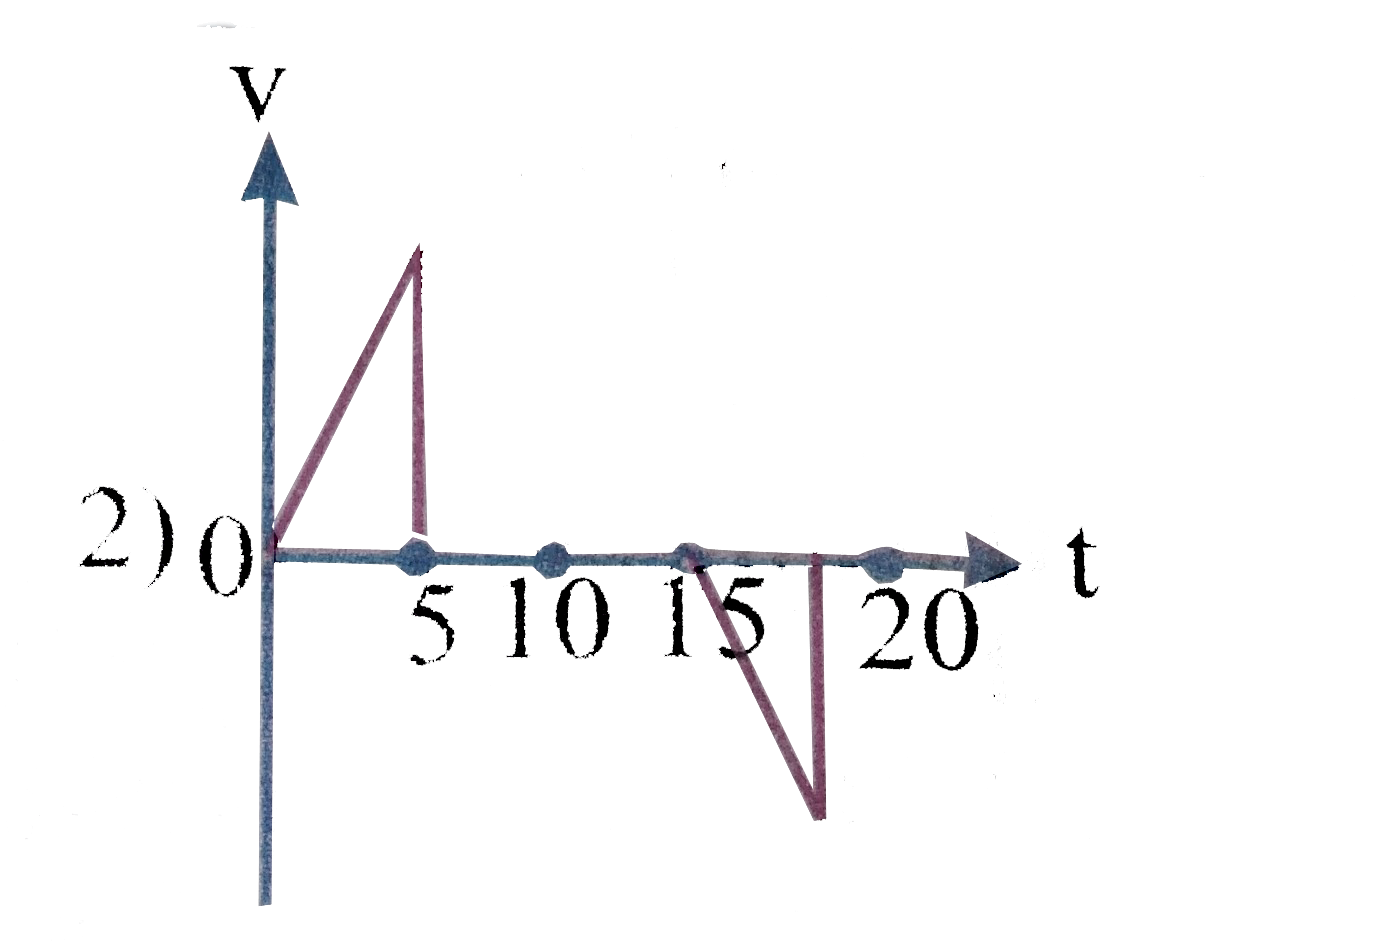 C
C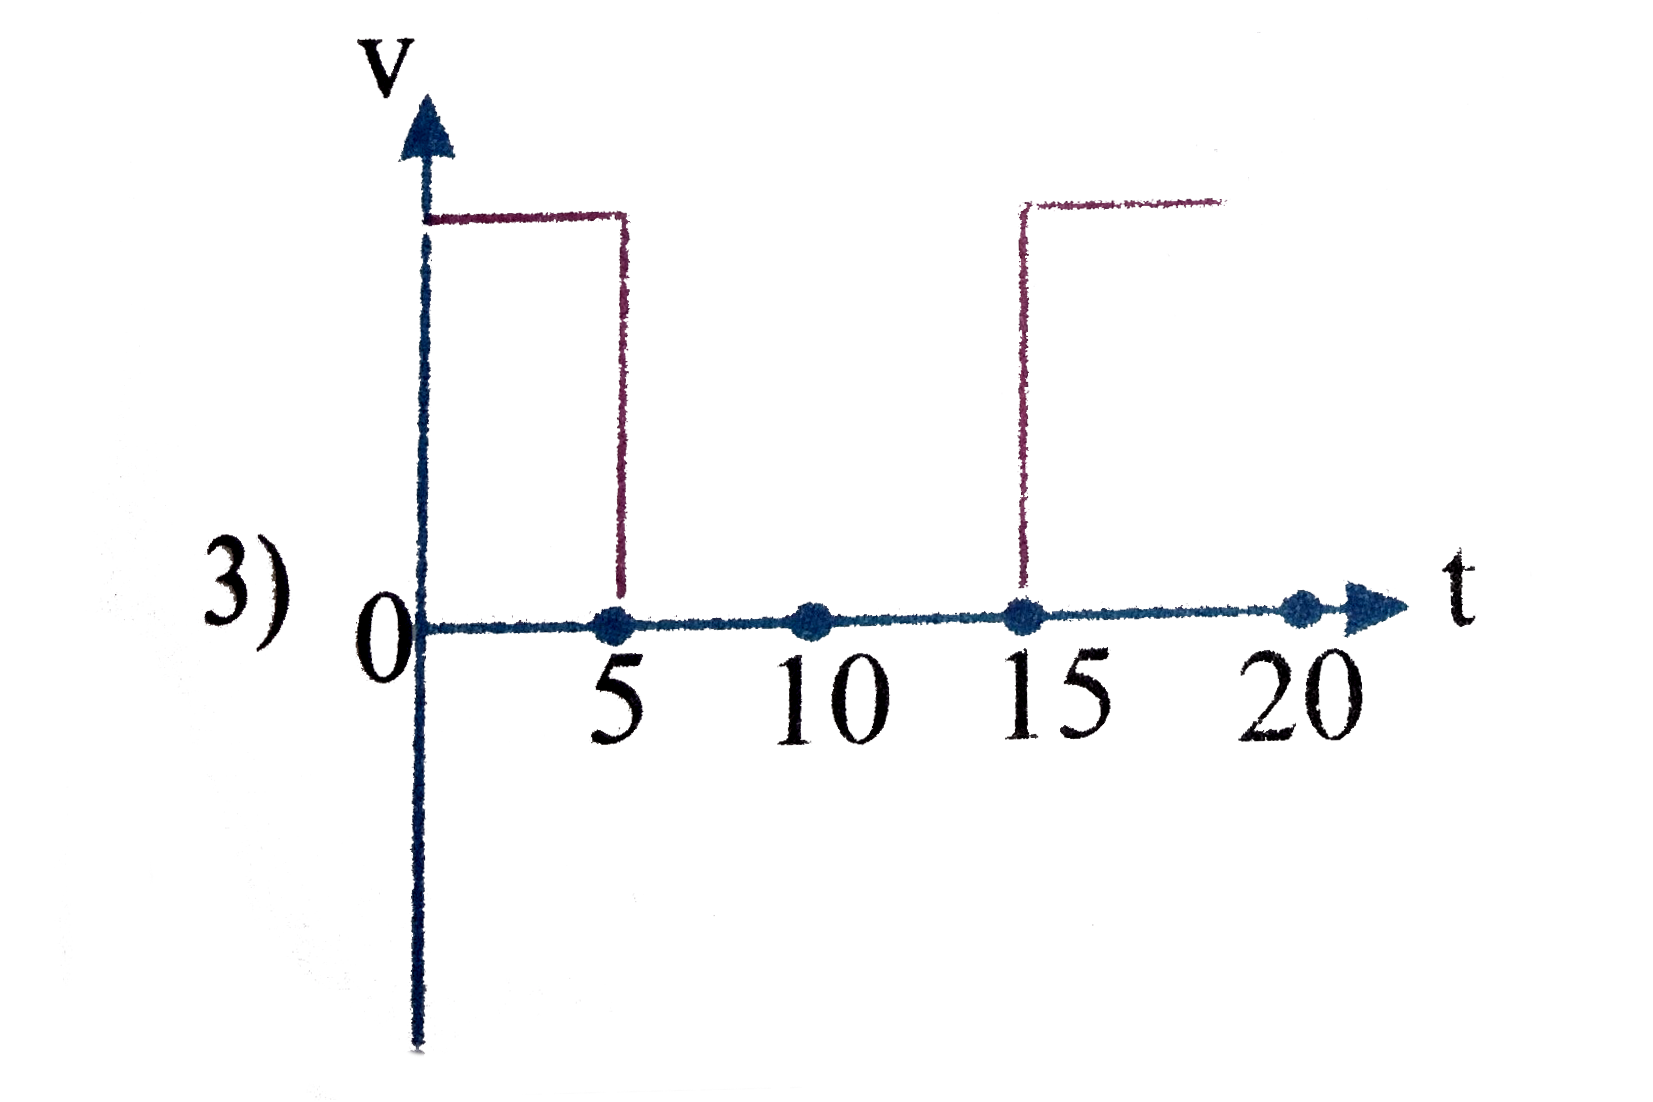 D
D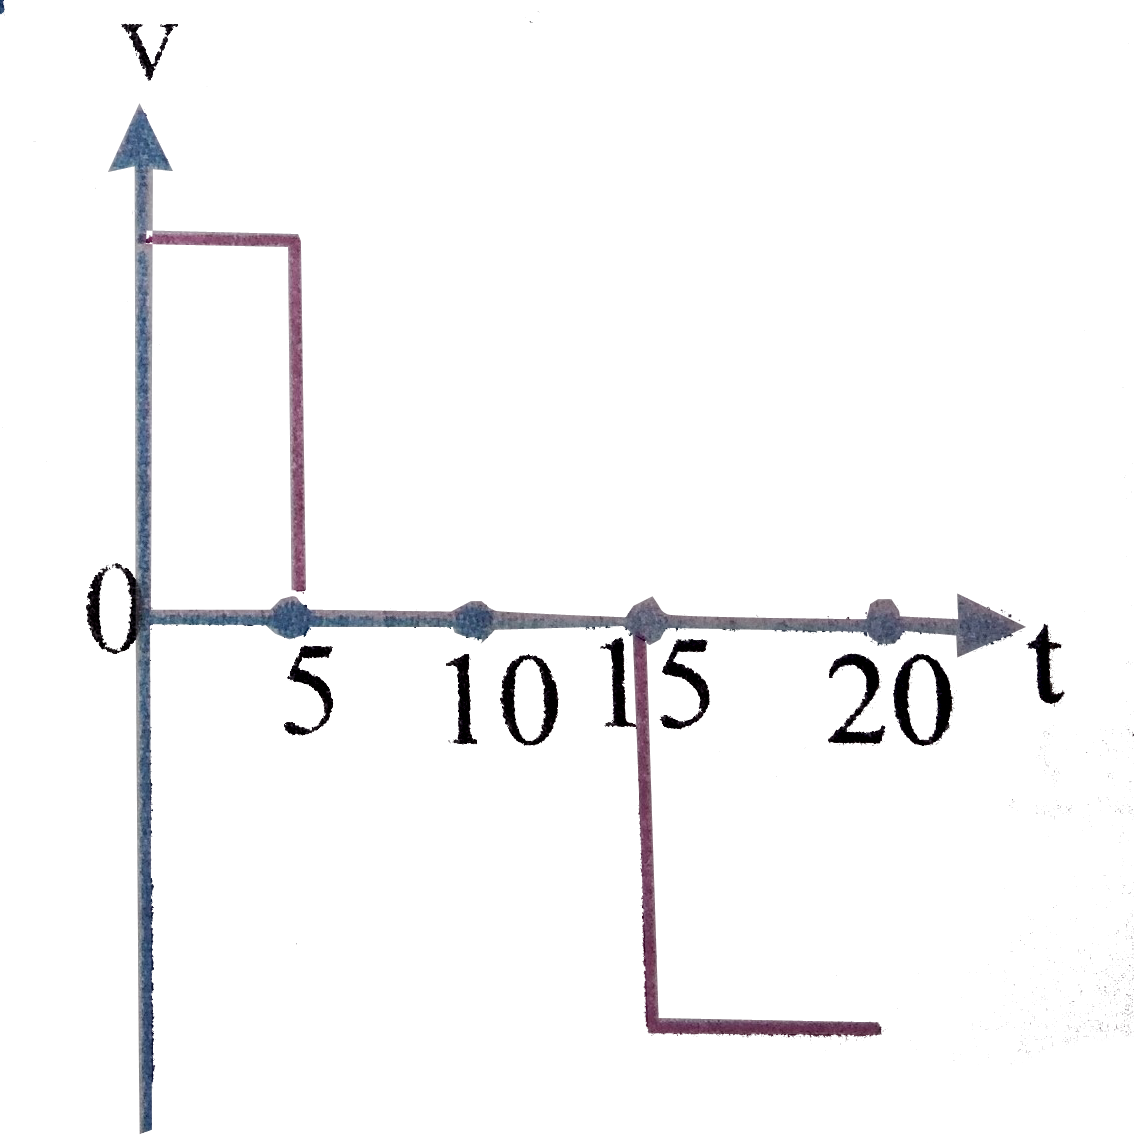
The velocity -time (v−t) graph of a particle moving in a straight line is shown in figure. The acceleration of the particle at t=9 is:
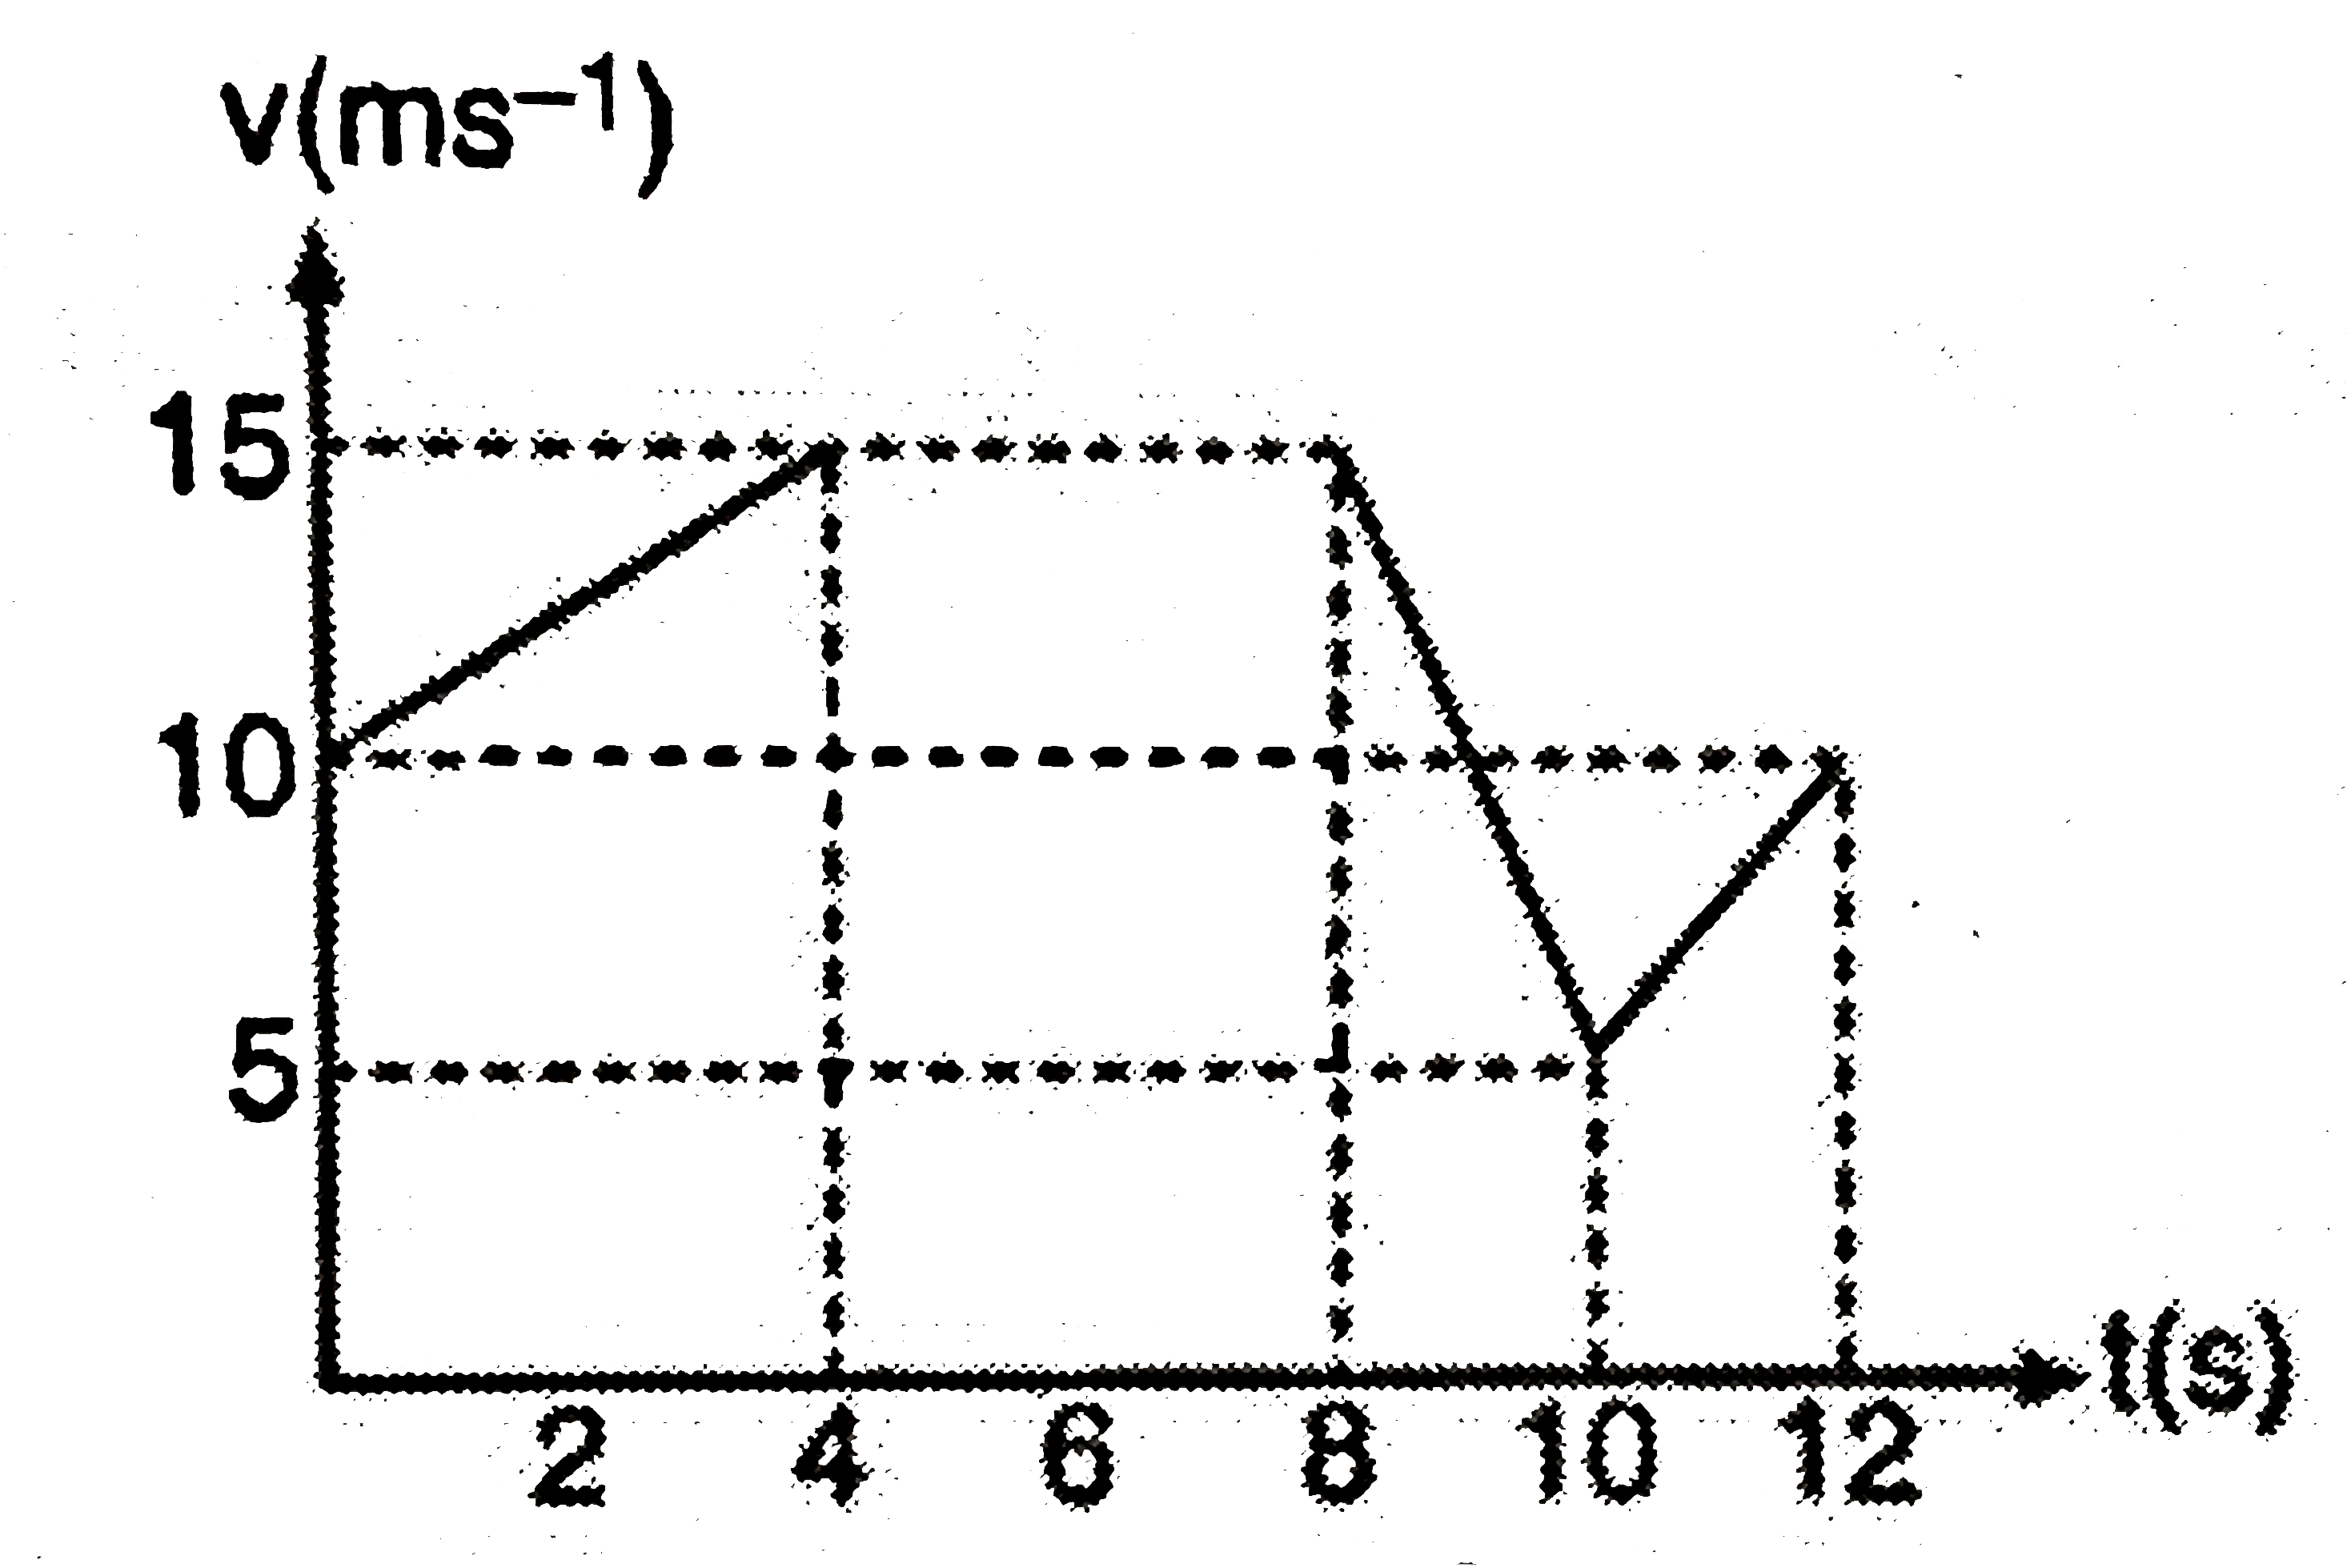 AzeroB5ms−2C−5ms2D−2ms−2
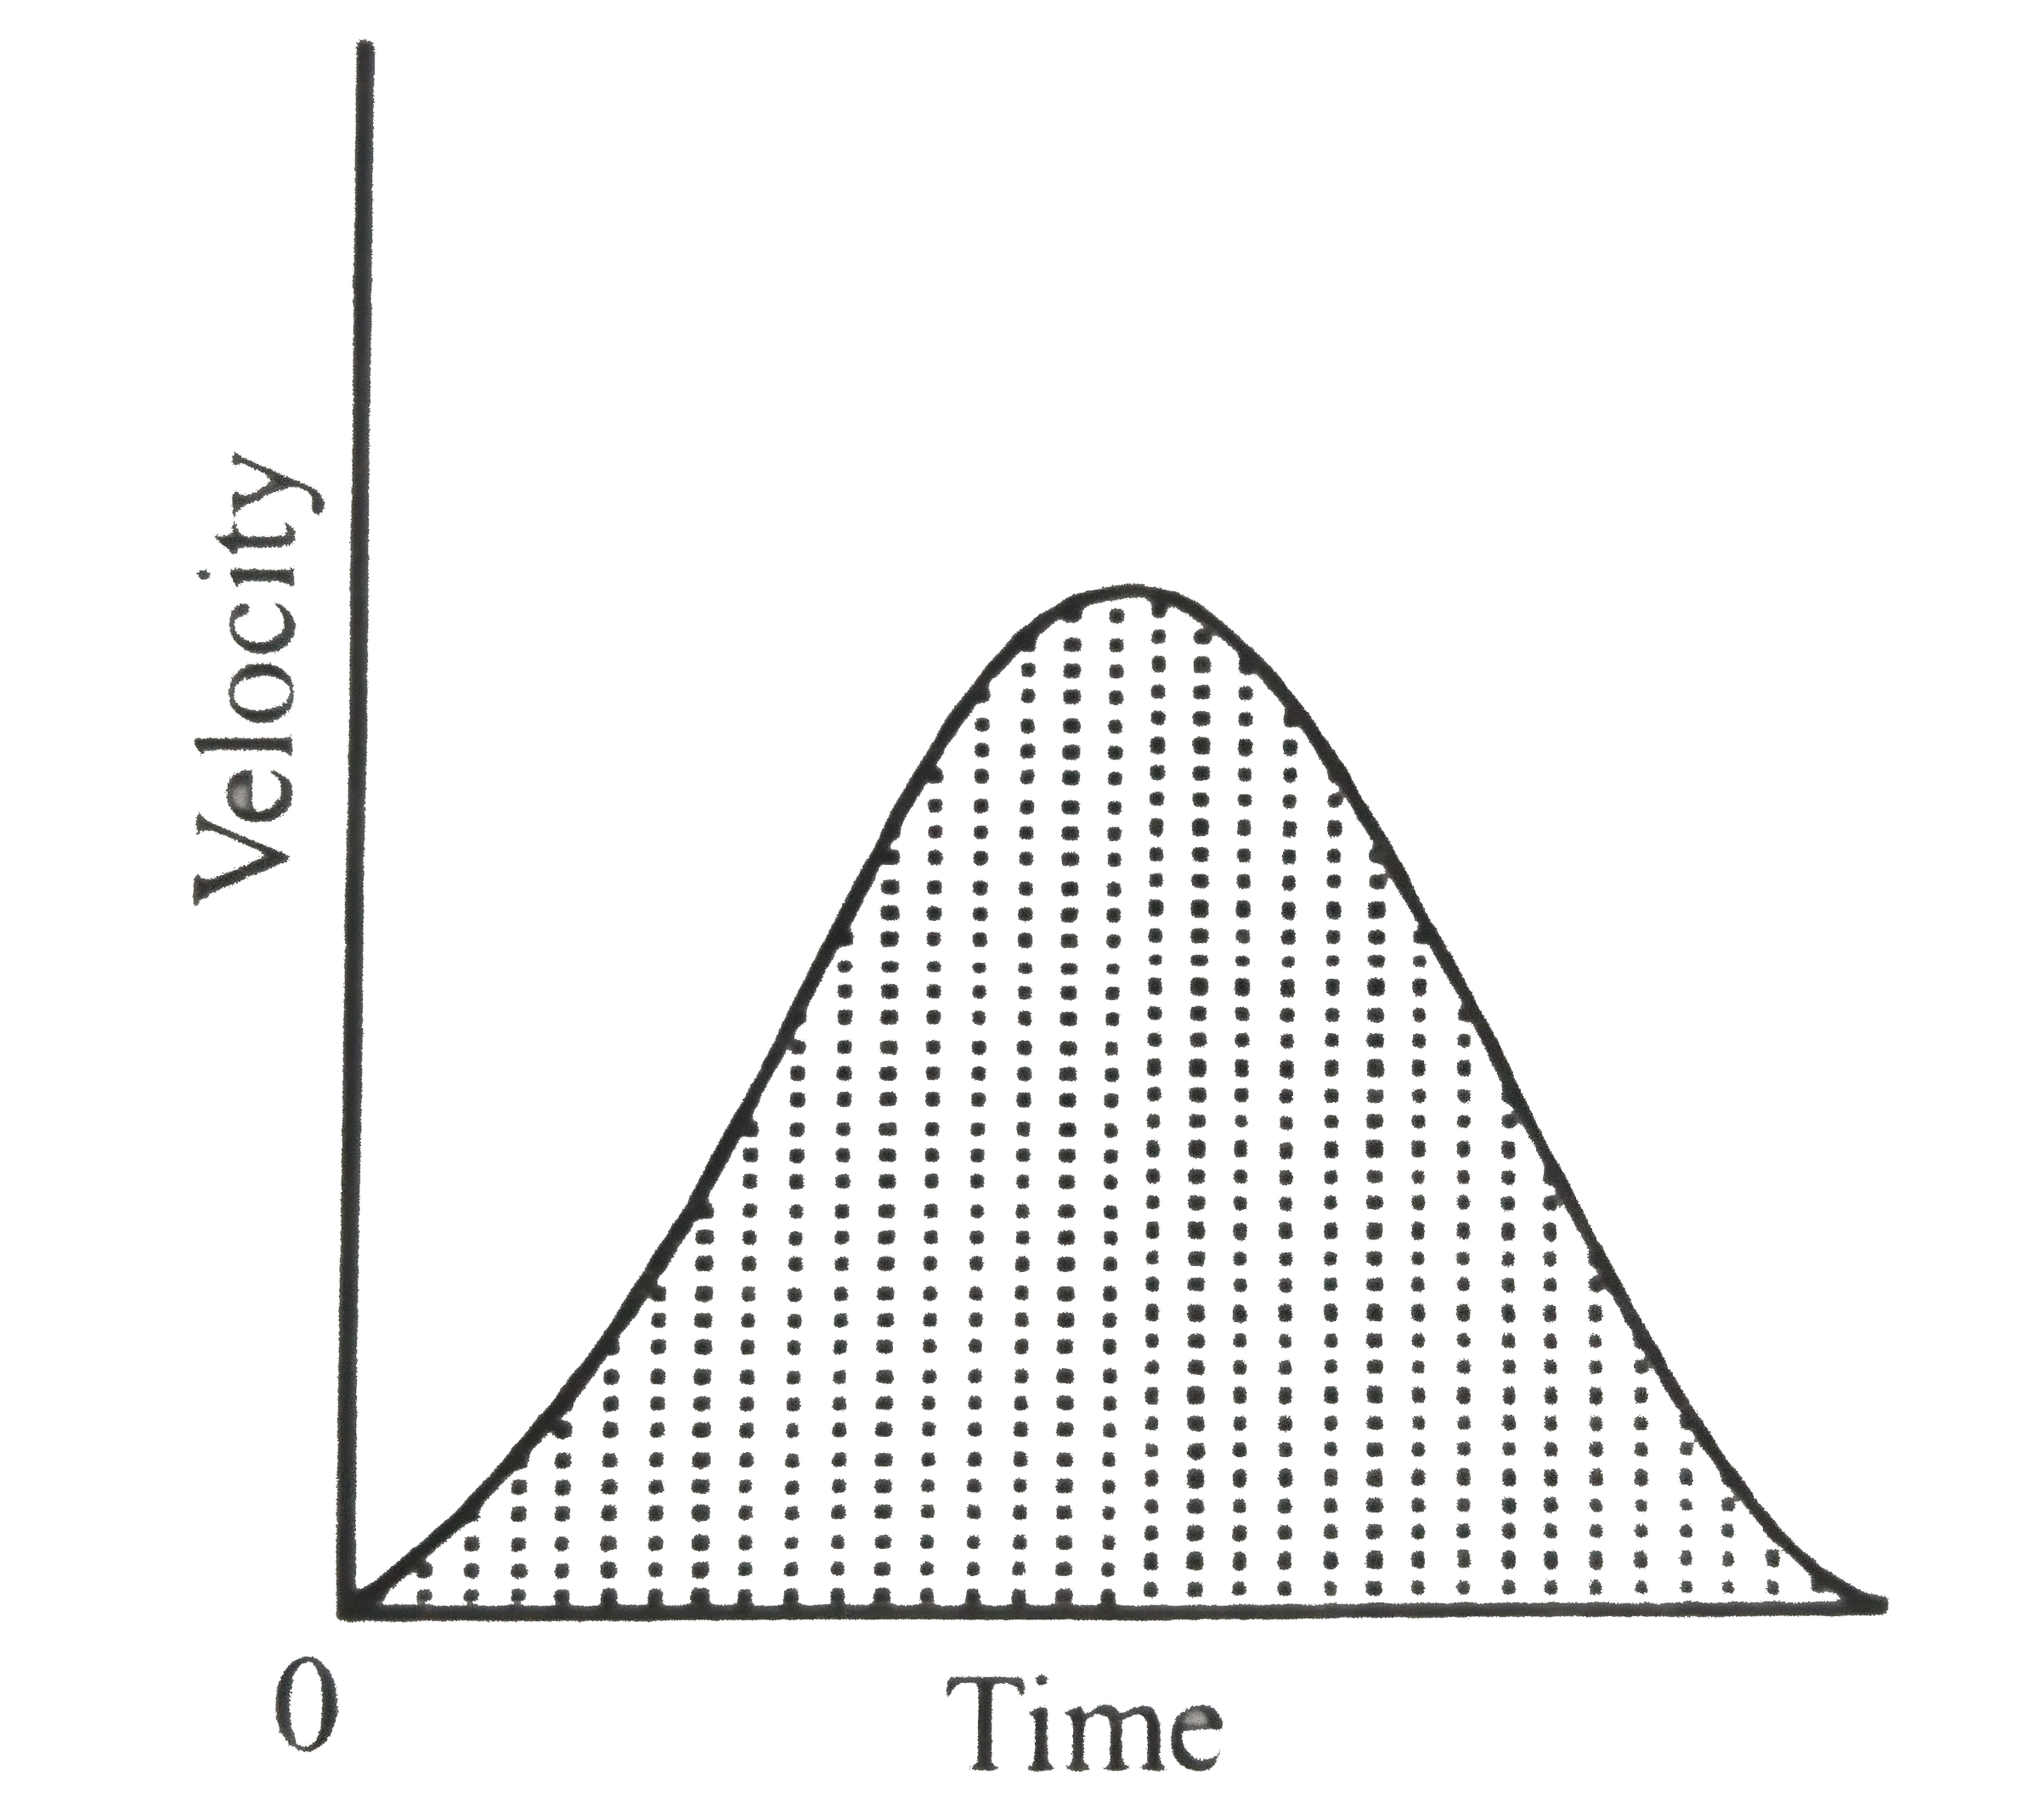
Which one of the following characteristics of the particle does the shaded area of the velocity-time graph shown above represent?
View SolutionThe velocity (u)-time (t) graph of an object moving along a straight line is as shown is Fig. 2 (b) . 30. Calculate the distance covered by object between (i)t=0→t=5s (ii) t=0→t=10s.
 .
.
View SolutionWhich of the following shows the velocity (v) - time (t) graph for a falling apple?
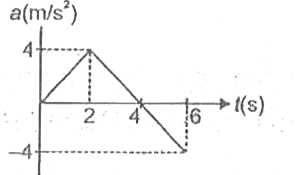
View SolutionFor the acceleration - time (a - t) graph shown in figure, the change in velocity of particle from t = 0 to t = 6 s is
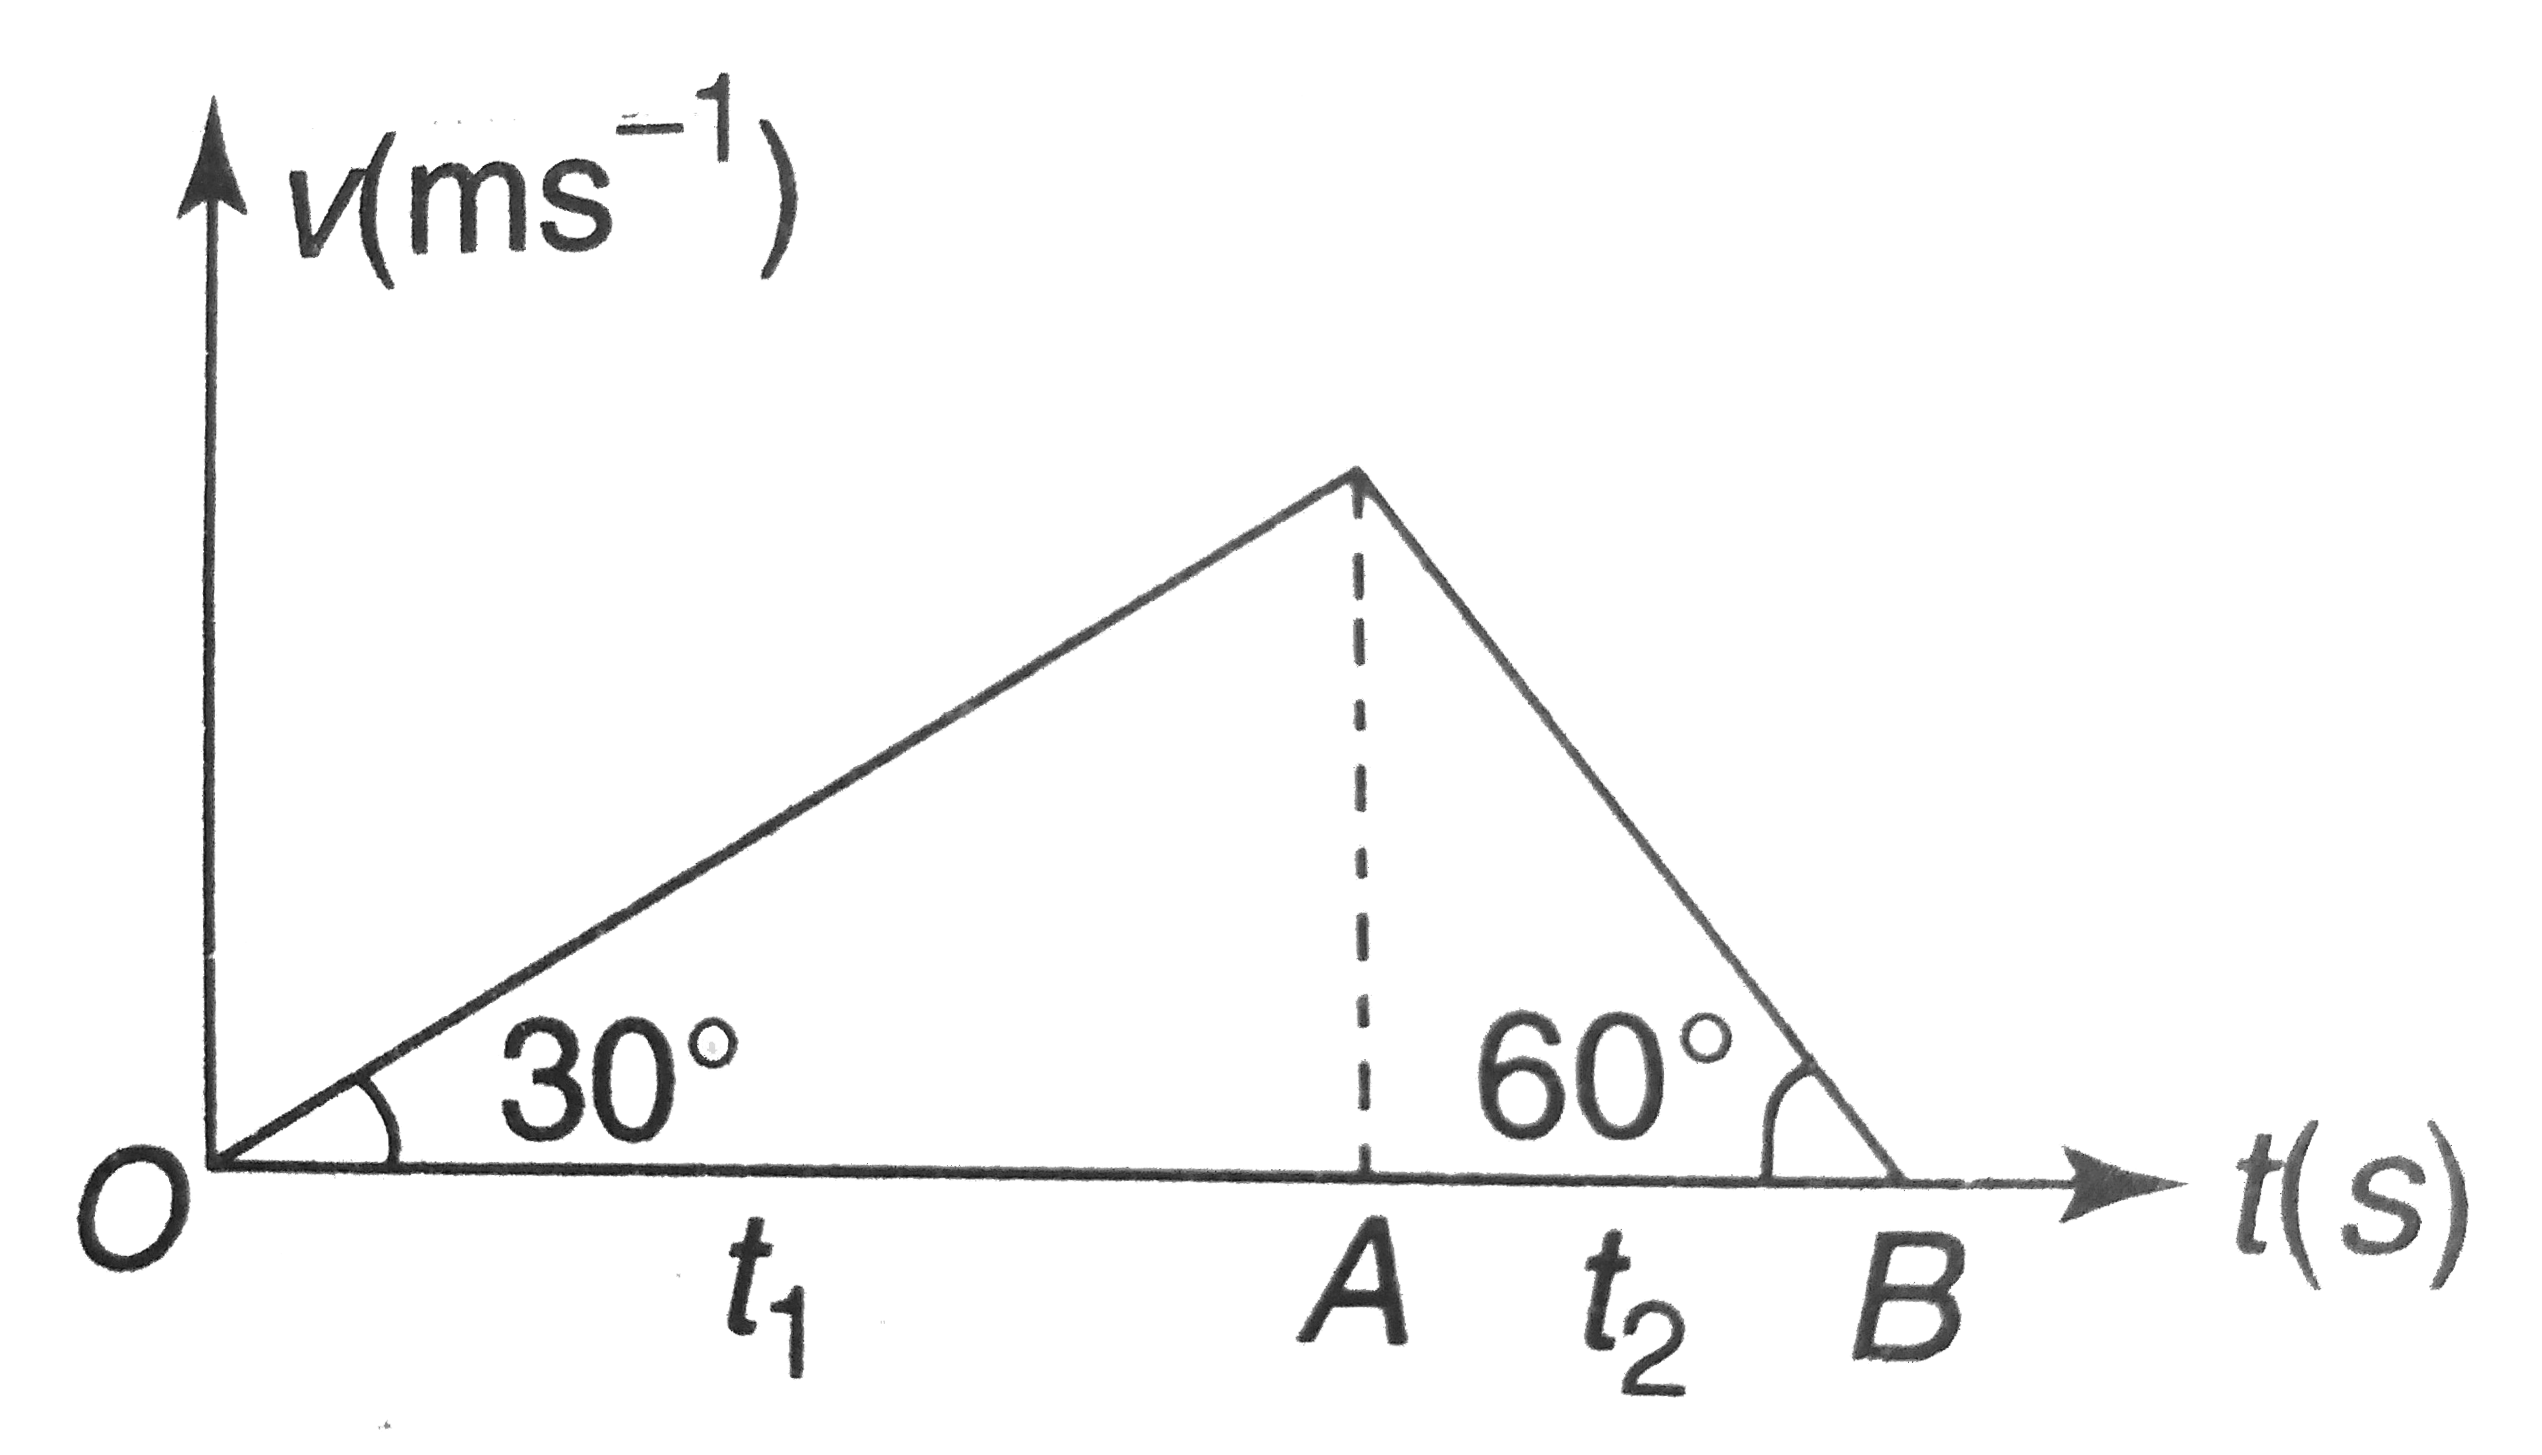
View SolutionThe velocity time graph of a body moving along a straight line is shown in figure. The ratio of the average velocities during the time t1 and t2 is.
View Solution
