Read the following information and answer the four items that follow :
Let the distribution of number of scooters of companies X and Y sold by 5 showrooms (A, B, C, D and E) in a certain year be denoted by S1 and the distribution of number of scooters of only company X sold by the five showrooms in the same year be denoted by S2.

What is the average number of scooters of company Y sold by the showrooms A, C and E ?
46113
43113
42613
41613
Step by step video & image solution for Read the following information and answer the four items that follow : Let the distribution of number of scooters of companies X and Y sold by 5 showrooms (A, B, C, D and E) in a certain year be denoted by S1 and the distribution of number of scooters of only company X sold by the five showrooms in the same year be denoted by S2. What is the average number of scooters of company Y sold by the showrooms A, C and E ? by Maths experts to help you in doubts & scoring excellent marks in Class 14 exams.
Updated on:21/07/2023Similar Questions
Read the following information and answer the four items that follow :
Let the distribution of number of scooters of companies X and Y sold by 5 showrooms (A, B, C, D and E) in a certain year be denoted by S1 and the distribution of number of scooters of only company X sold by the five showrooms in the same year be denoted by S2.
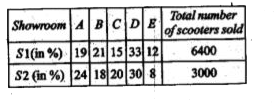
What is the difference between the number of scooters of both companies sold by showroom A and total number of scooters of company X sold by showrooms B and E together?
View SolutionRead the following information and answer the four items that follow :
Let the distribution of number of scooters of companies X and Y sold by 5 showrooms (A, B, C, D and E) in a certain year be denoted by S1 and the distribution of number of scooters of only company X sold by the five showrooms in the same year be denoted by S2.

Number of scooters of company Y sold by showroom E is what per cent of the number of scooters of both companies sold by showroom C ?
View Solution
Knowledge Check
The table shows the number of cars sold by three showrooms over a period of six years.
यह तालिका तीन शोरूम द्वारा छः वर्षों की अवधि में बेची गयी कारों की संख्या दर्शाती है |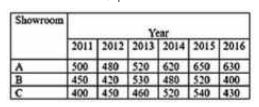 What is the average number of cars sold by showroom A over the given six years (nearest to one decimal place)?
दिए गए छः वर्षों में शोरूम A द्वारा बेची गयी कारों की औसत संख्या कितनी है ? (एक दशमलव स्थान के निकटतम )A586.7B566.7C594.7D592.7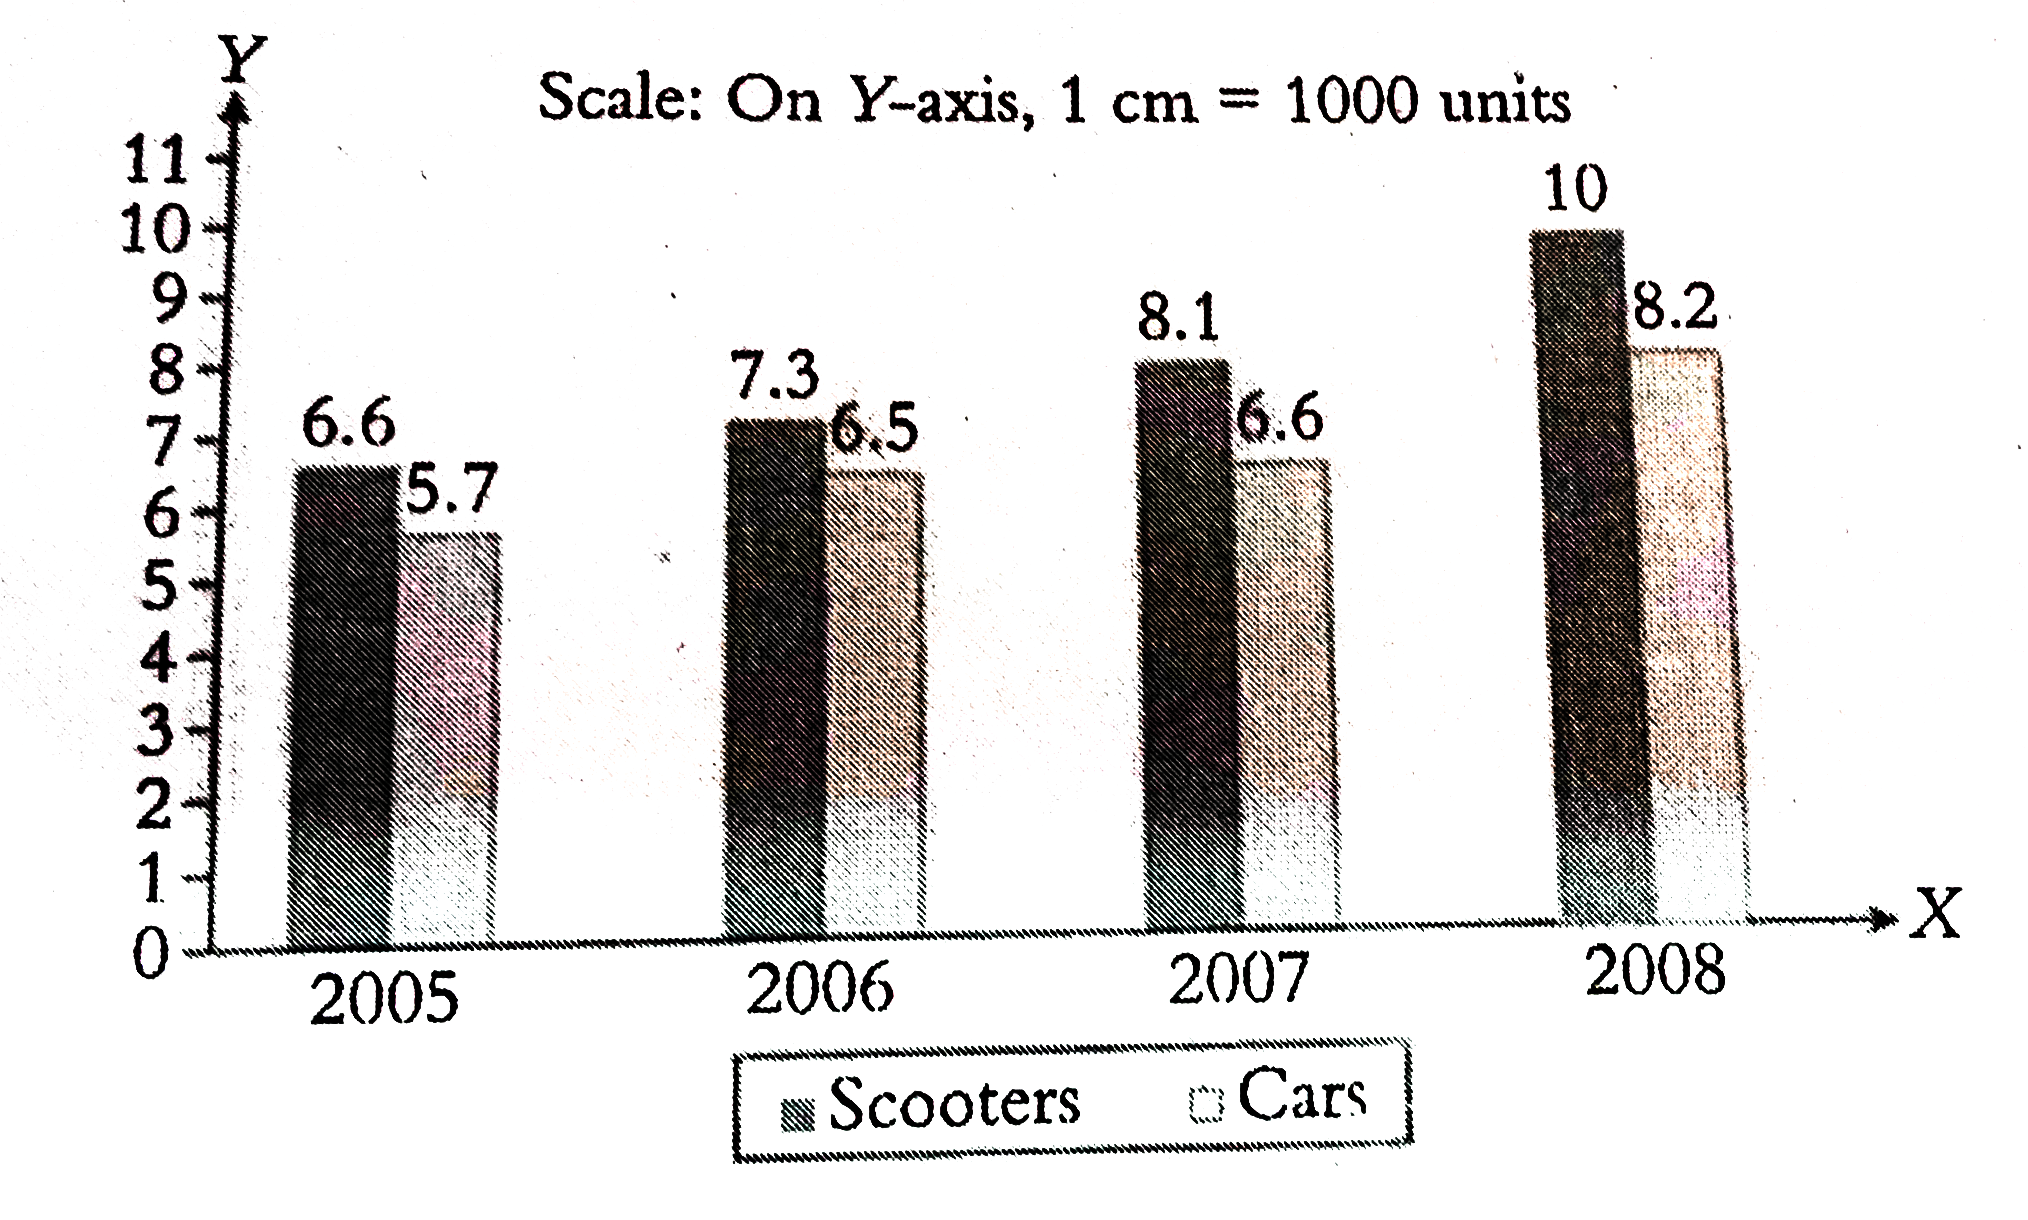
Find the total number of scooters sold in the four years.A26000B27000C31000D32000The given pie-chart represents the distribution of the percentage of sales of a particular brand of car from five showrooms A, B, C, D and E during 2018. The total number of cars sold during that year from the five showrooms is 5000.
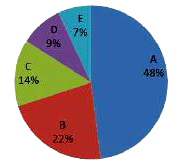
What is the total number of cars sold from the show rooms B and D?A1450B1750C1550D1650
Read the following information and answer the four items that follow :
Let the distribution of number of scooters of companies X and Y sold by 5 showrooms (A, B, C, D and E) in a certain year be denoted by S1 and the distribution of number of scooters of only company X sold by the five showrooms in the same year be denoted by S2.

Number of scooters of both the companies sold by showroom B is what per cent more than the number of scooters of company X sold by showroom A ?
View SolutionRead the following information and answer the four items that follow :
The data shows that Indian roads are turning deadlier over the years.
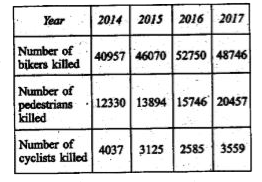
What is the average number of bikers killed daily in road accidents in the year 2017 ?
View SolutionThe given pie chart represents the distribution of the percentage of sales of a particular brand of car from five showrooms A B C D and E during 2018 The total number of cars sold during that year from the five showsrooms in 5000.
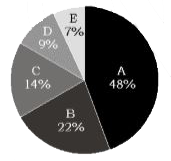
What is the total number of cars sold from the showrooms B and D?
View SolutionThe given pie-chart represents the distribution of the percentage of sales of a particular brand of car from five showrooms A, B, C, D and E during 2018. The total number of cars sold during that year from the five showrooms is 5000.
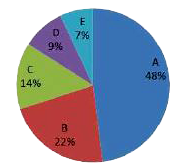
What is the central angle (nearest to 0.1 degree) of the sector corresponding to the sales from the showroom C?
View SolutionThe table shows the number of cars sold by three showrooms over a period of six years.
यह तालिका तीन शोरूम द्वारा छः वर्षों की अवधि में बेची गयी कारों की संख्या दर्शाती है |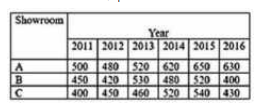 By what percent did the total number of cars sold by all three showrooms decrease during the year 2016, as compared to that in the year 2015 (nearest to one decimal place)?
वर्ष 2015 की तुलना में वर्ष 2016 में तीनों शोरूम के द्वारा बेची गयी कारों की कुल संख्या में कितने प्रतिशत की कमी आयी है ? (एक दशमलव स्थान के निकटतम )
View Solution
