Read the following information and answer the four items that follow :
The data shows that Indian roads are turning deadlier over the years.
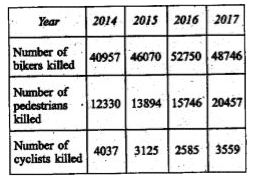
What is the approximate percentage change in the pedestrians' fatalities during the period 2014–17 ?
66%
68%
71%
76%
Step by step video & image solution for Read the following information and answer the four items that follow : The data shows that Indian roads are turning deadlier over the years. What is the approximate percentage change in the pedestrians' fatalities during the period 2014–17 ? by Maths experts to help you in doubts & scoring excellent marks in Class 14 exams.
Updated on:21/07/2023Similar Questions
Read the following information and answer the four items that follow :
The data shows that Indian roads are turning deadlier over the years.
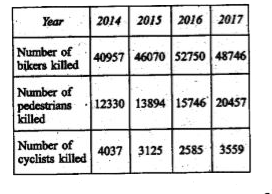
What was the average number of pedestrians killed per day in the year 2017?
View SolutionRead the following information and answer the four items that follow :
The data shows that Indian roads are turning deadlier over the years.
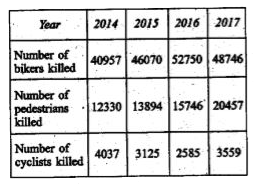
What is the average number of cyclists killed daily in road accidents in 2017?
View Solution
Knowledge Check
Study the following graph carefully and answer the questions that follow
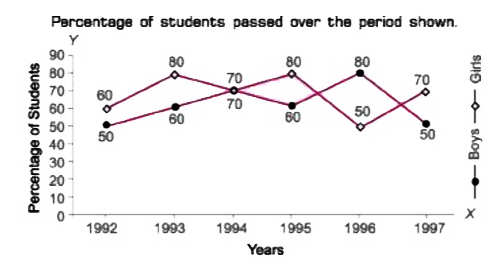
What is the over all percentage of failed boys over the period shown ?A6123B35C3513D3813Study the following graph carefully and answer the questions that follow
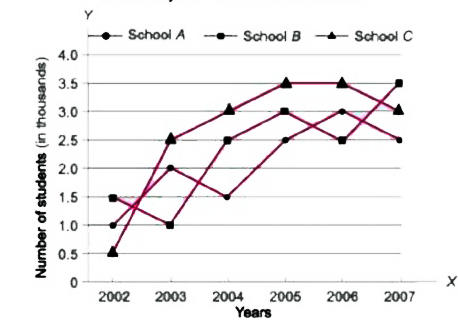
What was the approximate average number of students in school A over all the years together ?A1990B2090C2300D1800Study the given bar chat and answer the question that follows.
production of Fertilizers by a Company (in 10,000 tonnes) Over the Years
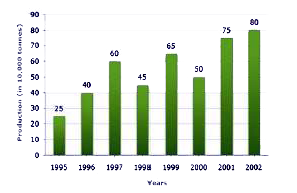
What was the approximate percentage increase in the production of fertilizers from 1998 to 1999 ?A44.4%B50%C40%D48.4%
Read the following information and answer the four items that follow :
The data shows that Indian roads are turning deadlier over the years.
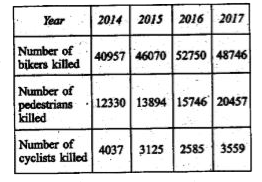
What is the average number of bikers killed daily in road accidents in the year 2017 ?
View SolutionStudy the following information carefully and answer the given questions: The following bar graph shows the price per square feet of lands in different years
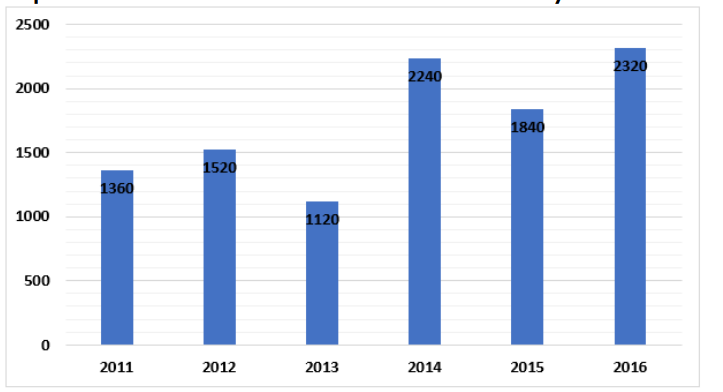
The price per square feet in the year 2011 and 2014 together is approximately what percentage of the price per square feet in the year 2012 and 2015 together?
View SolutionObserve the graph below and answer the following question
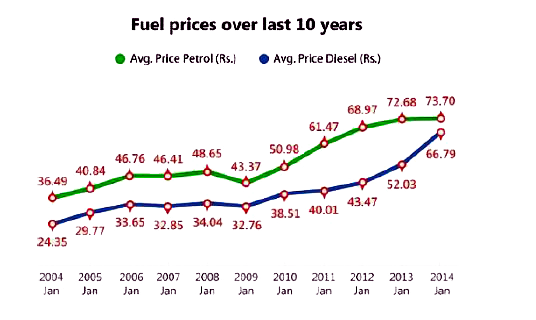
What is the approximate percentage difference in average price of Petrol in 2004 and in 2014?
View SolutionStudy the following graph carefully to answer the questions that follows
The % of five different types of cars produced by a company during two years is given below:
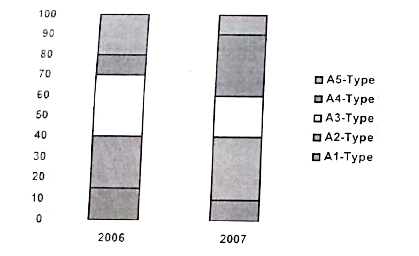
what is the approximate % share of A1 type in the total production of 2007?
View SolutionObserve the graph below and answer the following question.
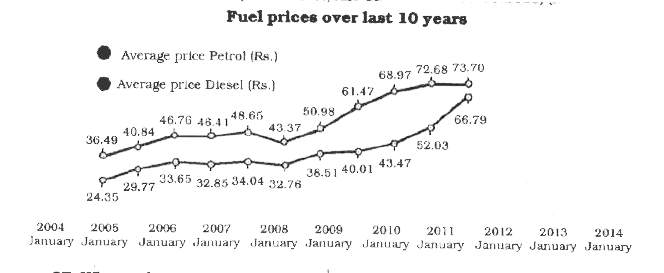
What is the approximate percentage difference in average price of petrol in 2004 and in 2014?
View Solution