The following graph shows the production of paddy in ihe agricultural land available the 6 places S1,S2,S3,S4,S5,S6 (area in hundreds of hectares and production in thousands of tonnes)
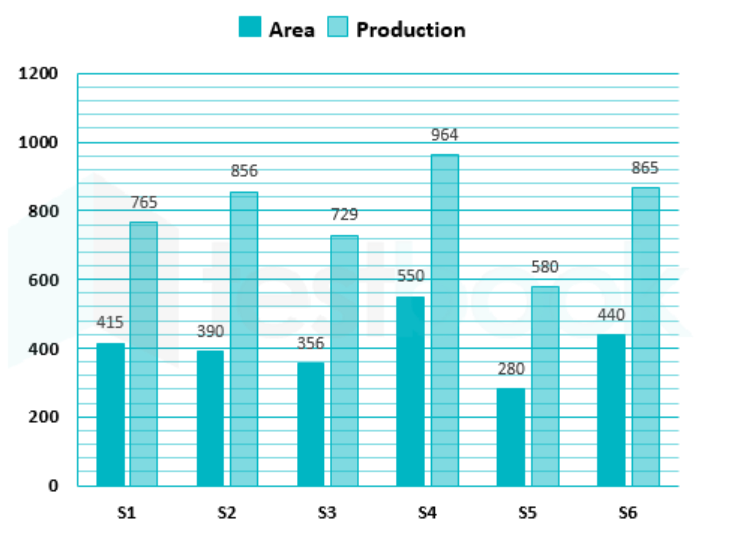
Based on the information, the production ratio (production to land) is highest and lowest, respec tively, in
A
S5 S3
B
S2, S1
C
S2, S4
D
S3, S6
Video Solution
Text Solution
The correct Answer is:C
|
Answer
Step by step video & image solution for The following graph shows the production of paddy in ihe agricultural land available the 6 places S_1 , S_2, S_3, S_4, S_5 , S_6 (area in hundreds of hectares and production in thousands of tonnes) Based on the information, the production ratio (production to land) is highest and lowest, respec tively, in by Maths experts to help you in doubts & scoring excellent marks in Class 14 exams.
Updated on:21/07/2023Similar Questions
Knowledge Check
In the following reactiona, the product S is
 A
A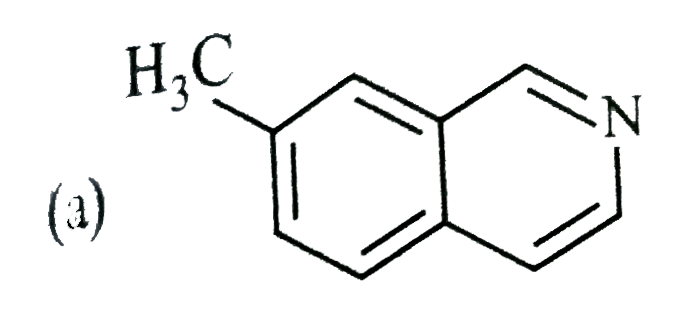 B
B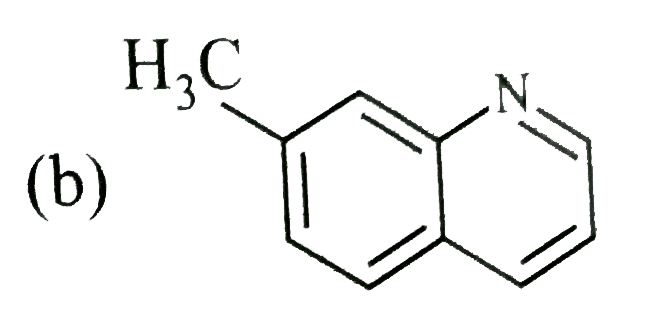 C
C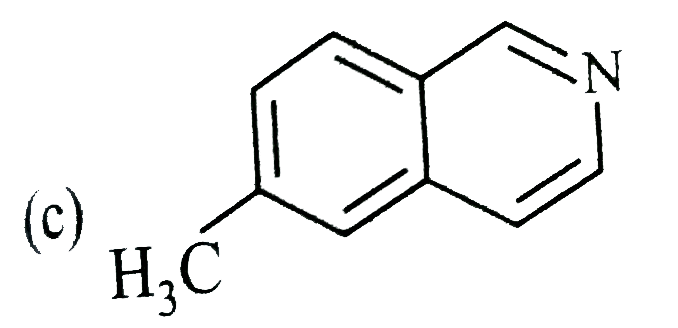 D
D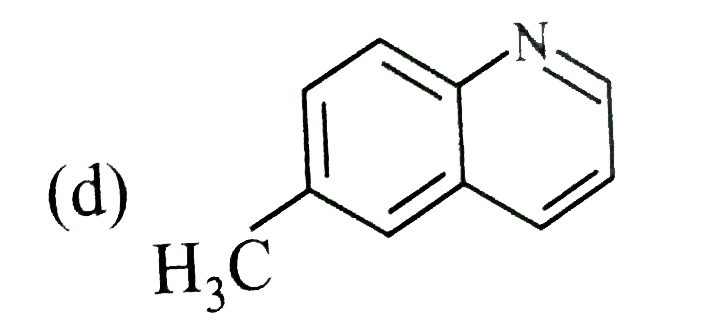
In the following reactions, the product S is
 A
A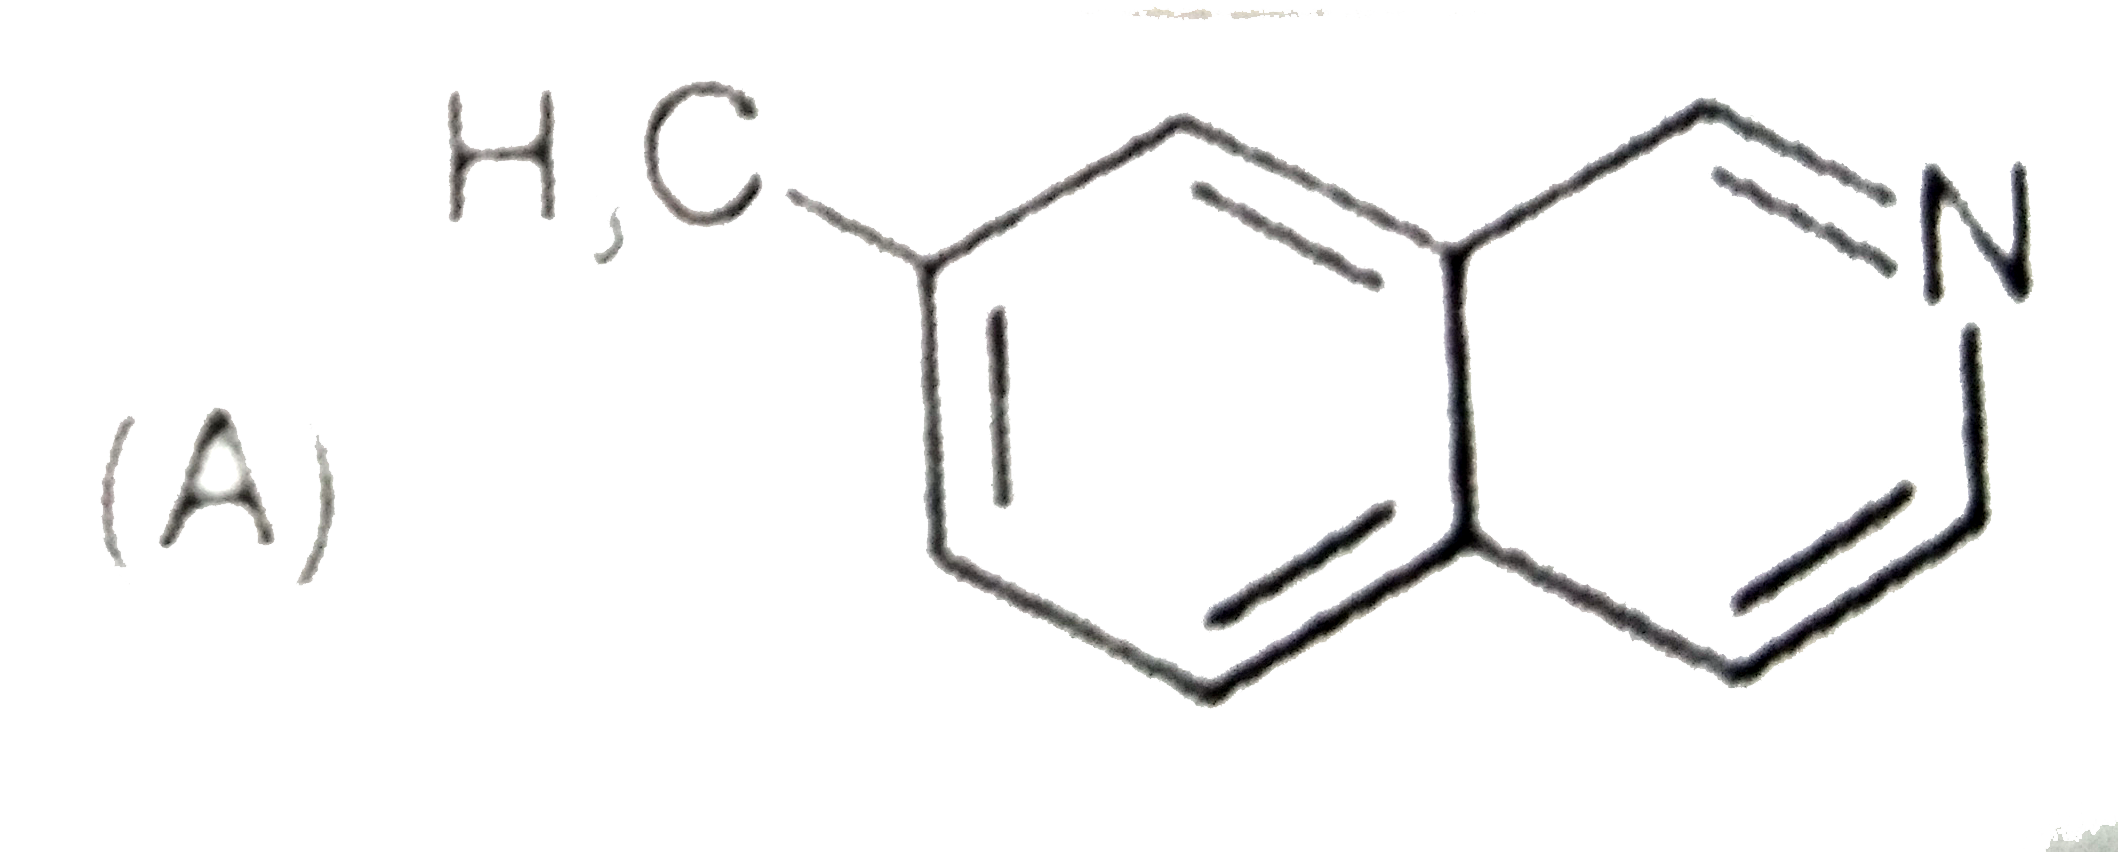 B
B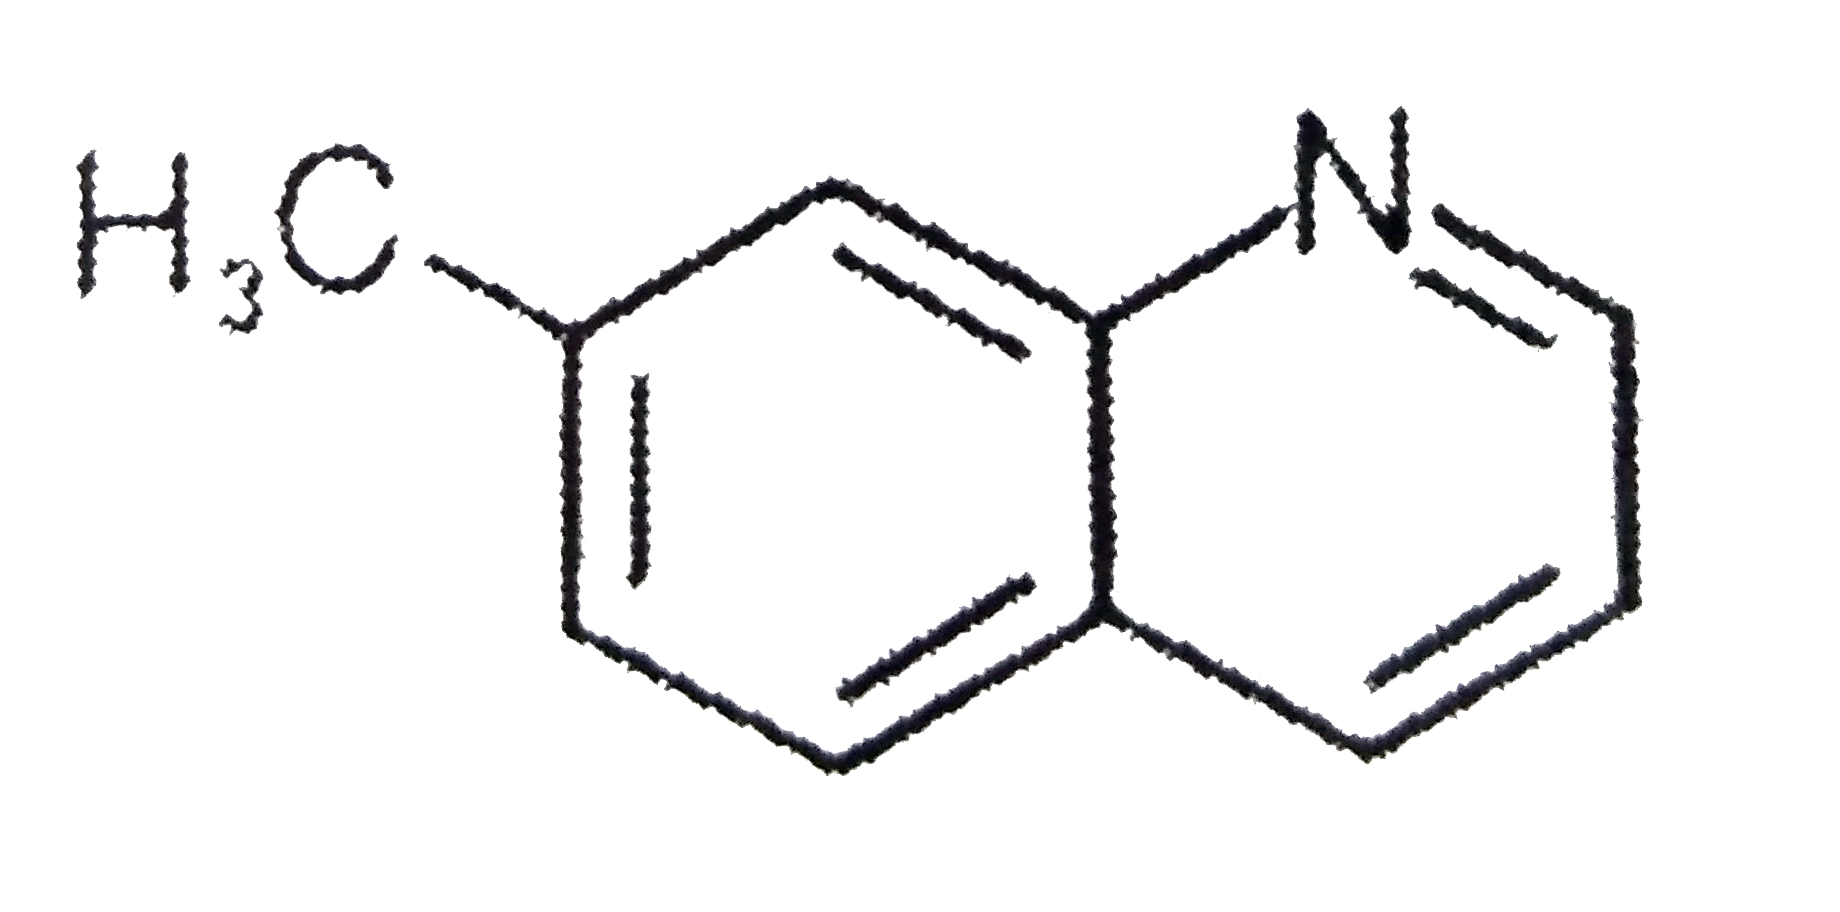 C
C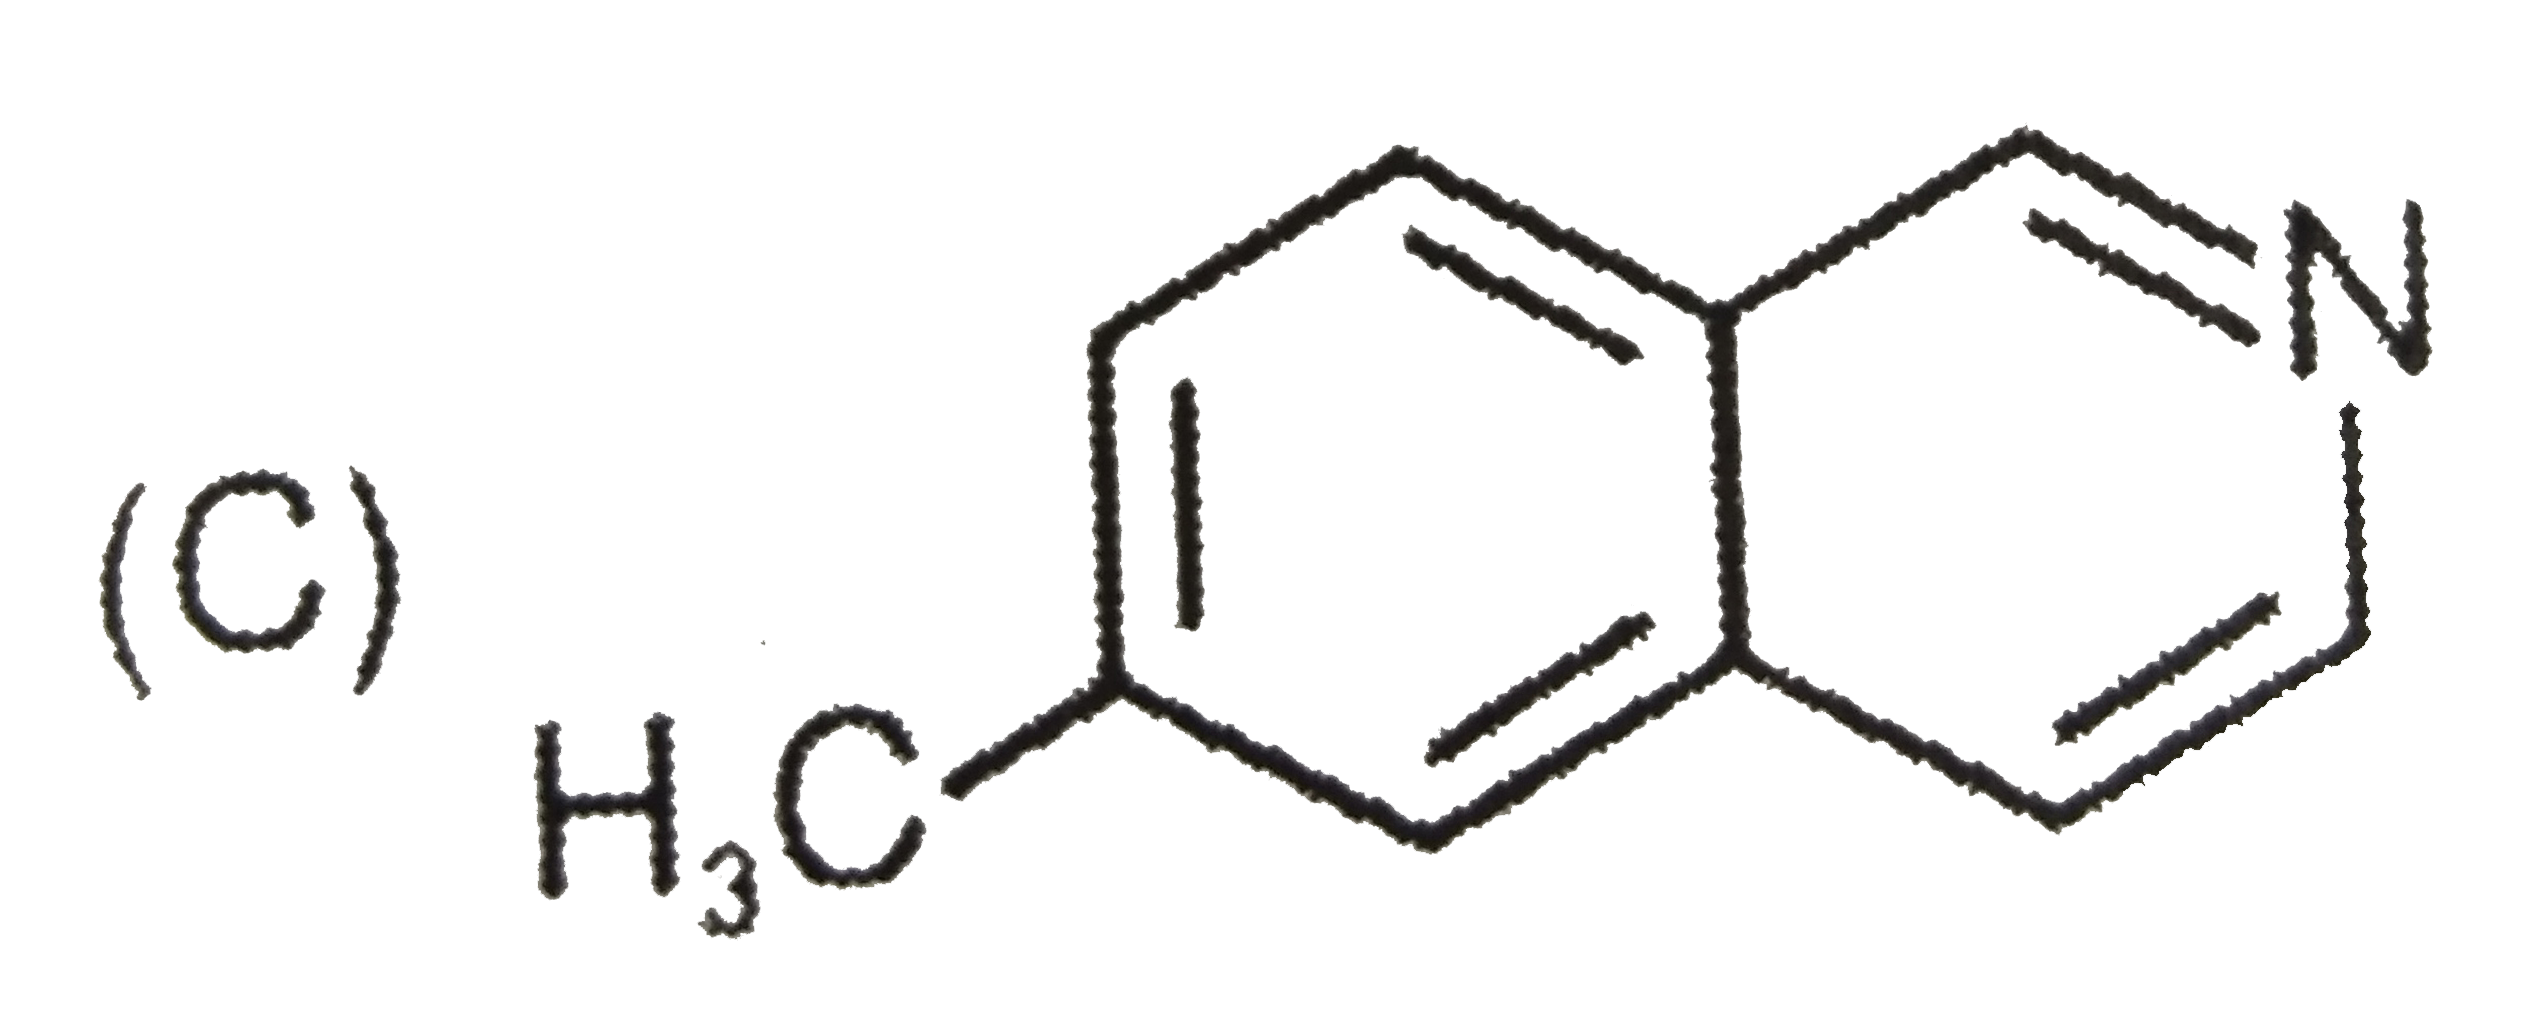 D
D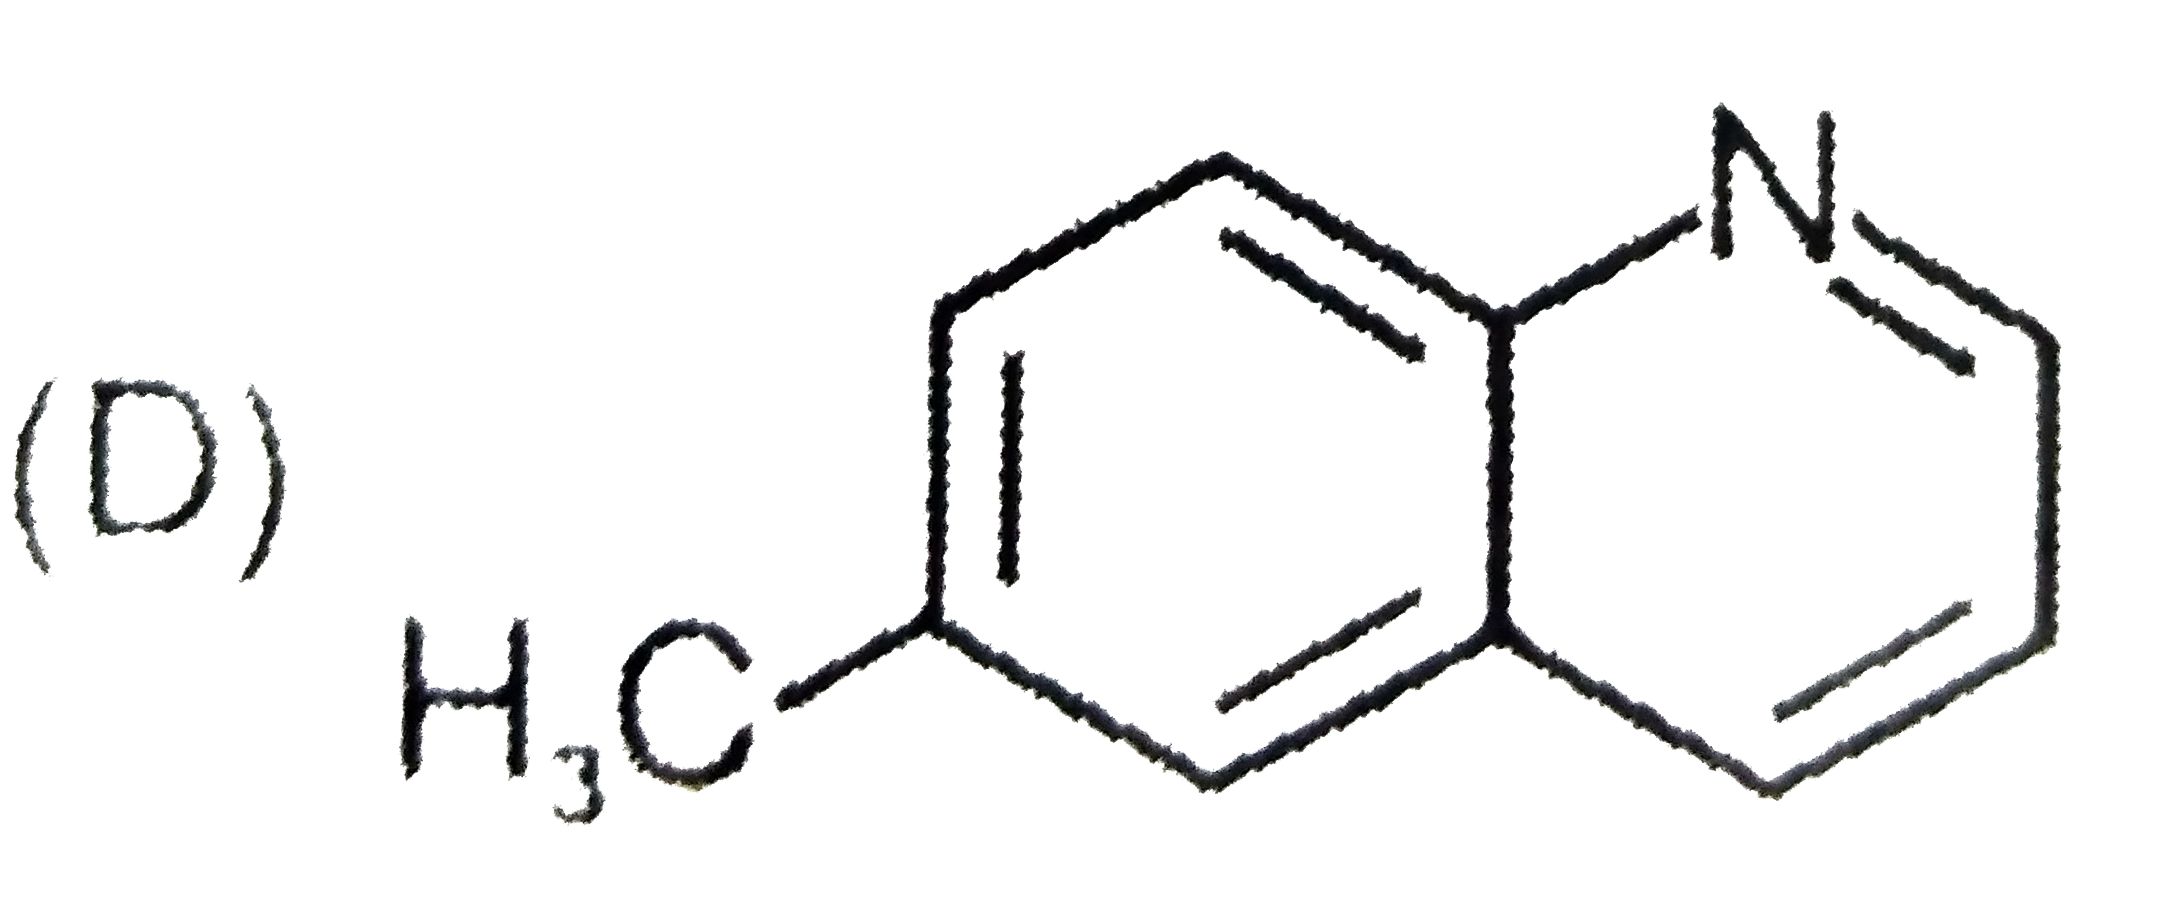
In the following reactions the product S is
 A
A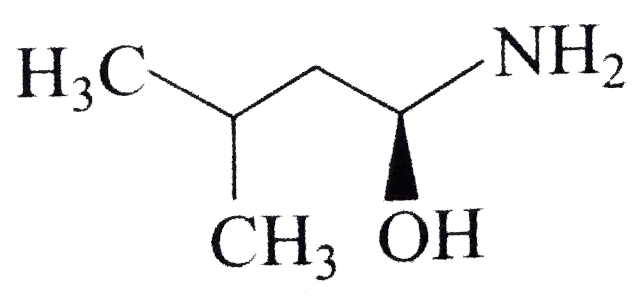 B
B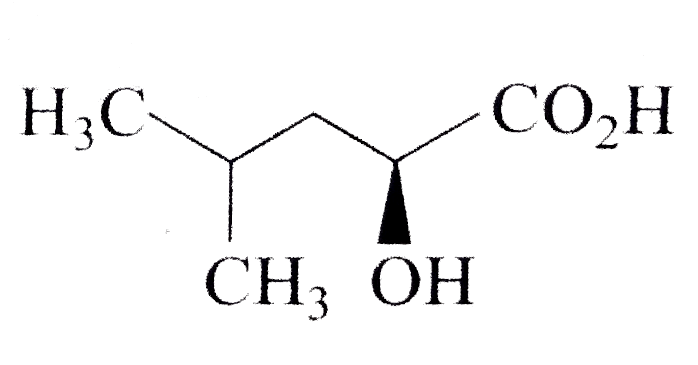 C
C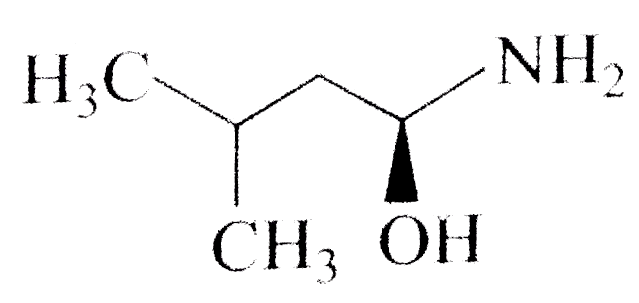 D
D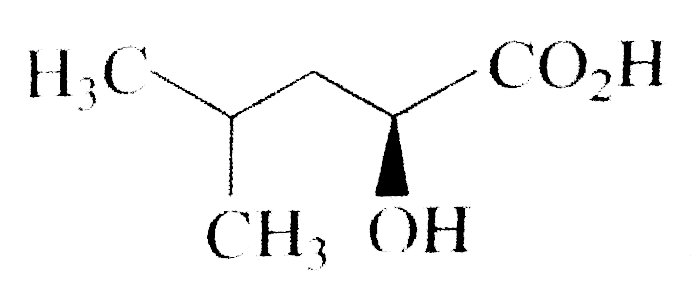
In the following reaction, the product(s) formed is
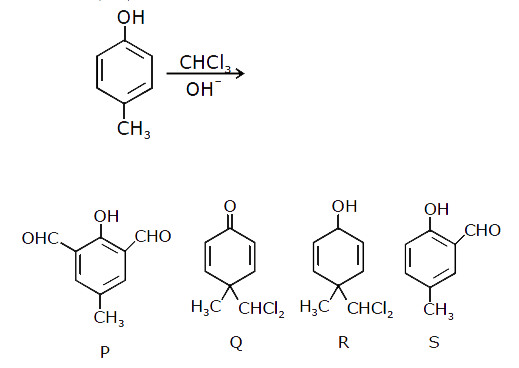
View SolutionIn the following reactions the product S is

View SolutionIn the following reaction, the product(s) formed is (are) :

View SolutionThe products/s of the following reation is
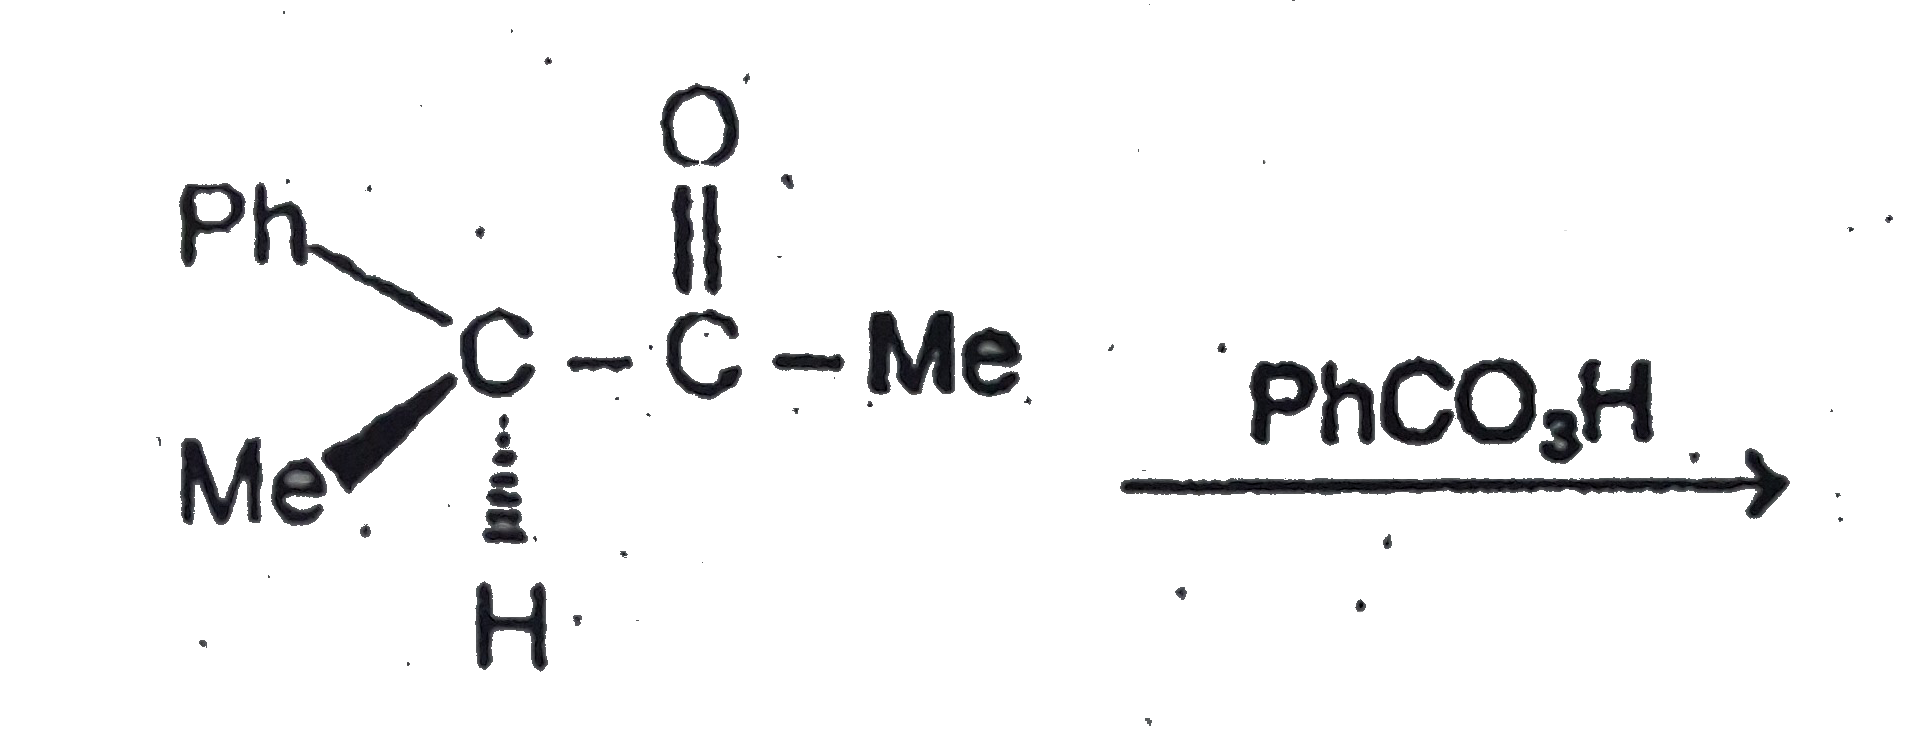
View SolutionWhat is the product of the following SN2 reaction ?
 .
.
View Solution


