The bar graph shows the number of motorcycles of different brands sold by dealer in a month . Study the diagram and answer the following questions.
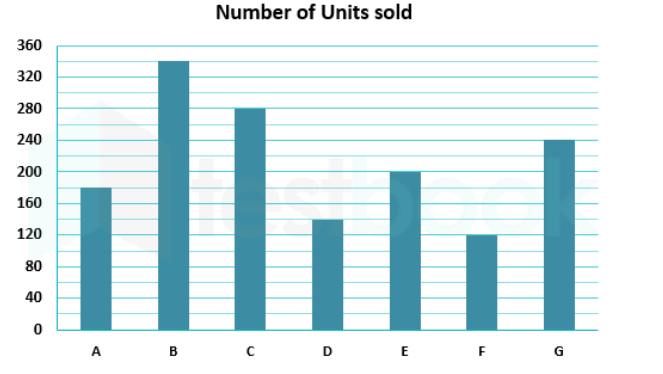
If the average price of a Motorcycle sold by the dealer is Rs 1 lakh then what is the sales (in Rs lakhs) of all the motorcycles sold by the dealer in the month?
150
1600
160
1500
The correct Answer is:A
Step by step video & image solution for The bar graph shows the number of motorcycles of different brands sold by dealer in a month . Study the diagram and answer the following questions. If the average price of a Motorcycle sold by the dealer is Rs 1 lakh then what is the sales (in Rs lakhs) of all the motorcycles sold by the dealer in the month? by Maths experts to help you in doubts & scoring excellent marks in Class 14 exams.
Updated on:21/07/2023Similar Questions
The bar graph shows the number of cars of different brands sold by a dealer in a month, Study the diagram and answer the following question.
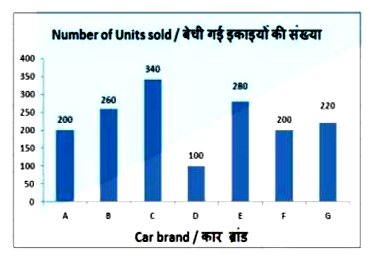
If the average price of a car sold by the dealer is Rs 5 lakhs then what is the sales (in Rs lakhs) of all the cars sold by the dealer in the month?
View SolutionThe bar graph showns the number of motorcycles of different brands sold by a dealer in a month . Study the diagram and answer the following questions.

Units sold of which Motorcycle brand were the second highest?
View Solution
Knowledge Check
The bar graph shows the number of employees working in the different departments of a company. Study the diagram and answer the following questions.
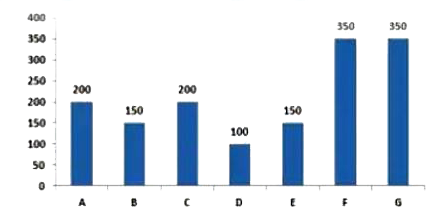
If the average compensation of an employee of department A is Rs 40,000 per month, then what is the total compensation (in Rs lakhs) of all employees of department A per month?A800B40C80D400The bar graph shows the annual sales of the different departments of a company. Study the diagram and answer the following questions.
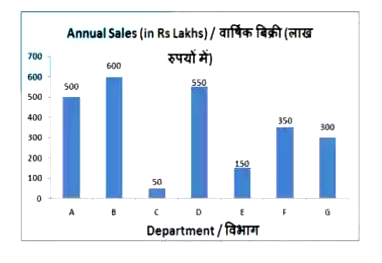
Which department has the second highest annual sales?ADBACBDFThe bar graph shows 1 month's sales of different brands of washing machines of a certain electronics store in Rs. 1000s. Study the diagram and answer the following questions.
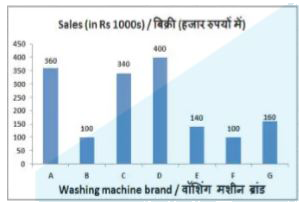
What is the ratio of sales of brand G to that of brand A?A9:4B1:2C2:1D4:9
The bar graph shows the number of motorcycles of different brands sold by a dealer in a month . Study the diagram and answer the following questions .

What is the ratio of units sold of brand A to that of brand C?
View SolutionThe bar graph shows the number of motorcycles of different brands sold by dealer in a month . Study the diagram and answer the following questions.

Units sold of brand D was lesser than that of brand E by _______.
View SolutionThe bar graph shows the number of cars of different brands sold by a dealer in a month. Study the diagram and answer the following question.
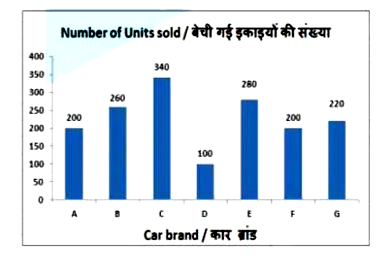
Units sold of which car brand were the second highest?
View SolutionThe bar graph shows the number of cars of different brands sold by a dealer in a month. Study the diagram and answer the following question.
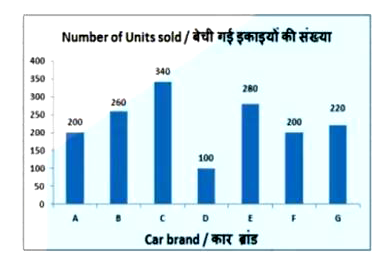
What is the ratio of units sold of brand G to that of brand E?
View SolutionThe bar graph shows the number of cars of different brands sold by a dealer in a month. Study the diagram and answer the following questions.
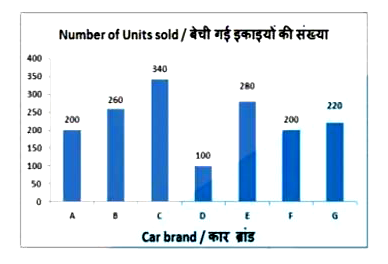
Units sold of brand D was lesser than that of brand F by _______.
View Solution
