The pie chart shows the number of students enrolled in the various engineering courses that a certain college offers. Study the diagram and answer the following questions.
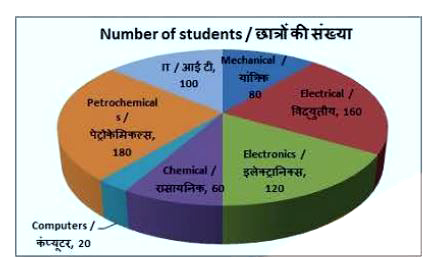
If the average annual fees paid by each student to enroll in this college is Rs 1.2 lakhs then what is the total annual fees (in Rs lakhs) collected by this college?
(a)864
(b)720
(c)956
(d)1080
864
720
956
1080
The correct Answer is:A
Step by step video, text & image solution for The pie chart shows the number of students enrolled in the various engineering courses that a certain college offers. Study the diagram and answer the following questions. If the average annual fees paid by each student to enroll in this college is Rs 1.2 lakhs then what is the total annual fees (in Rs lakhs) collected by this college? (a)864 (b)720 (c)956 (d)1080 by Maths experts to help you in doubts & scoring excellent marks in Class 14 exams.
Updated on:21/07/2023Similar Questions
The line graph show the number of student admitted in the given year to a certain university. Study the diagram and answer the following questions.
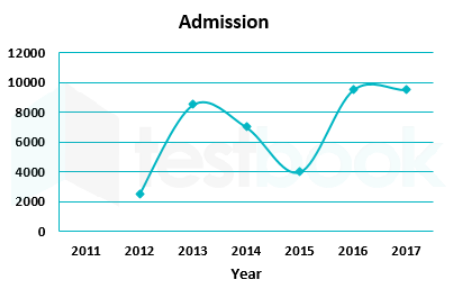
If average fees per student collected in 2014 was Rs 20, 000 what were the total fees collected (in Rs lakhs) in 2014 ?
View SolutionThe pie chart shows the breakup of expenditure of a manufacturing company for the year 2017. Study the diagram and answer the following questions.
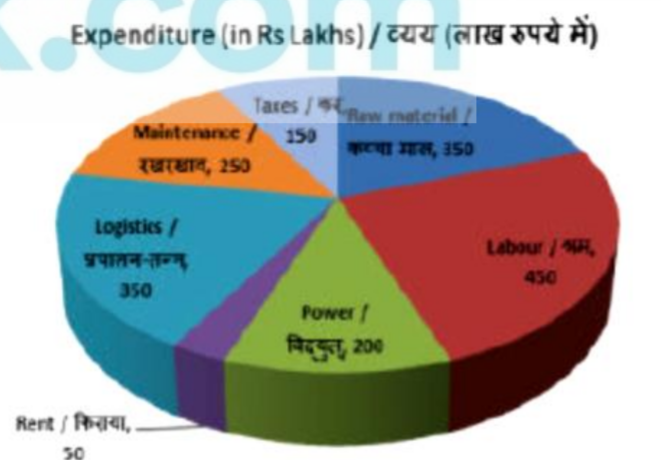
What is the total expenditure (in Rs lakhs)?
View Solution
Knowledge Check
The pie chart shows the number of students enrolled in the various engineering courses that a certain college offers. Studv the diagram and answer the following questions.
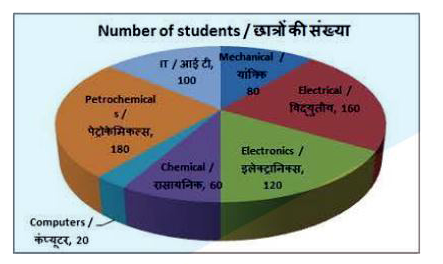
What is the total number of students enrolled in the college?Aa. 600Bb. 780Cc. 720Dd. 640The pie chart shows the number of students enrolled in the various engineering courses that a certain college offers. Study the diagram and answer the following questions.
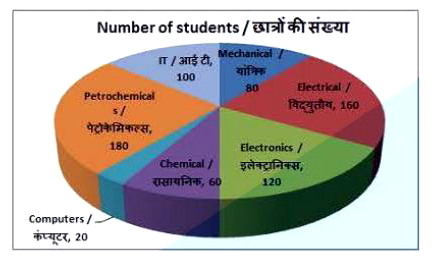
The most number of students are enrolled in which course?Aa. ITBb. ElectricalCc. ElectronicsDd. PetrochemicalsThe pie chart shows the number of students enrolled in the various engineering courses that a certain college offers. Study the diagram and answer the following questions.
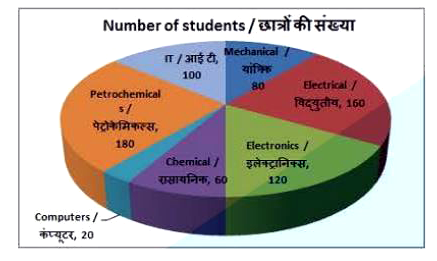
The measure of the central angle of the sector representing the Electrical course is_____ degrees.Aa. 120Bb. 90Cc. 100Dd. 80
The pie chart shows the breakup of expenditure of a mining company for the year 2017. Study the diagram and answer the following questions.
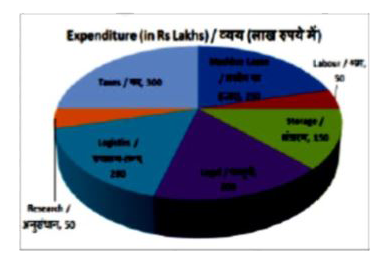
What is the total expenditure (in Rs lakhs)?
View SolutionThe pie chart shows the breakup of expenditure of a college for the year 2017. Study the diagram and answer the following questions.
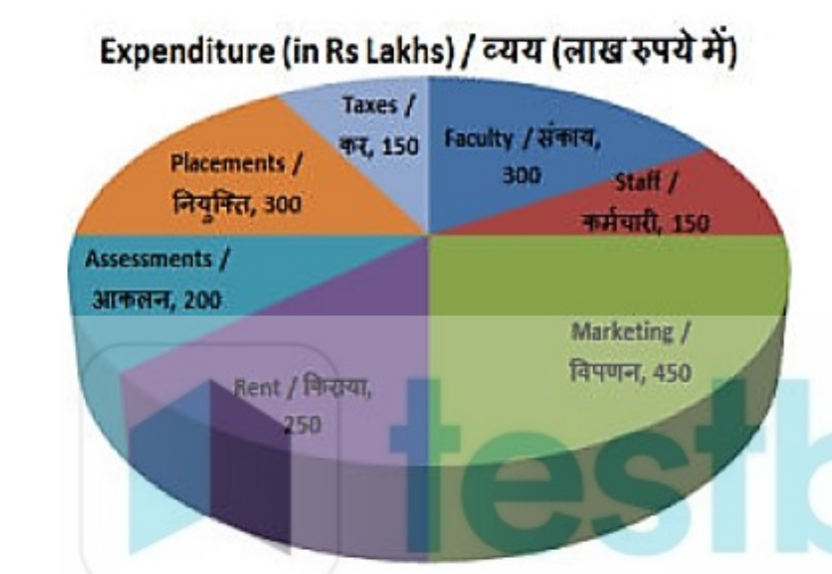
What is the total expenditure (in Rs lakhs)?
View SolutionThe pie chart shows the breakup of expendoture of a manufacturing company for the year 2017. Study the diagram and answer the following questions.
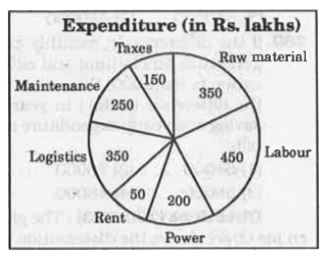
What is the total expenditure (in Rs. lakhs)?
View SolutionThe pie chart shows the breakup of expendoture of a software company for the year 2017. Study the diagram and answer the following questions.
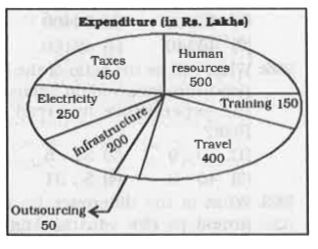
What is the total expenditure (in Rs. lakhs)?
View SolutionThe pie chart shows the breakup of expenditure of a software company for the year 2017. Study the diagram and answer the following questions.
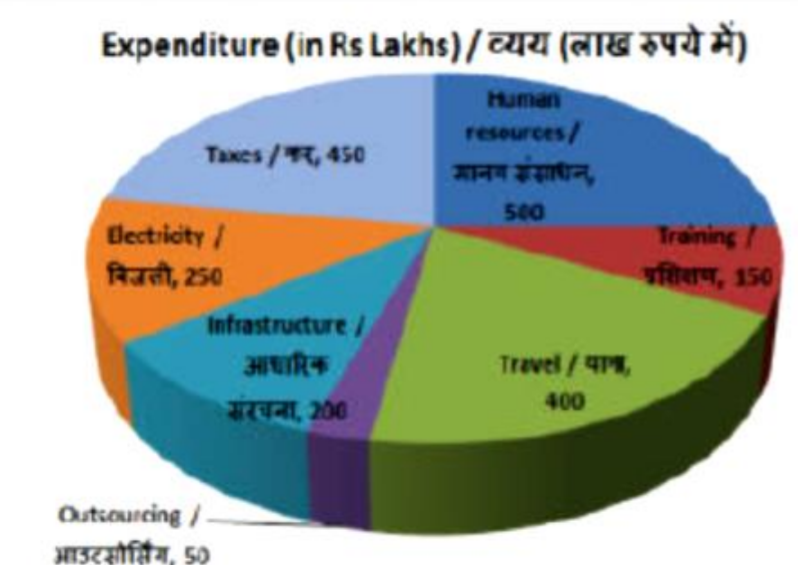
What is the total expenditure (in Rs lakhs)?
View Solution
