निम्नलिखित पाई चार्ट कर्मचारी चयन आयोग, कोलकाता के 1400 अधिकारियों के लिए परिवहन माध्यमों को दर्शाता है। चार्ट का अध्ययन कीजिए एवं प्रश्नों का उत्तर दीजिए :
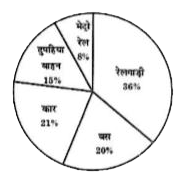
Write down the difference : (officers availing train - officers availaing car)
रेलगाड़ी से जाने वाले अधिकारियों तथा कार से जाने वाले अधिकारियों की संख्या का अंतर बताइए।
210
462
562
452
The correct Answer is:A
अभीष्ट अंतर = 36−21360×1400
= 15100×1400
= 15×14=210
Similar Questions
निम्नलिखित पाई चार्ट कर्मचारी चयन आयोग, कोलकाता के 1400 अधिकारियों के लिए परिवहन माध्यमों को दर्शाता है। चार्ट का अध्ययन कीजिए एवं प्रश्नों का उत्तर दीजिए :
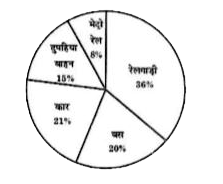
The ratio of two-wheelers and cars being used as modes of transport is.
परिवहन माध्यमों के रूप में प्रयुक्त दुपहिया वाहनों और कारों का अनुपात क्या है?View SolutionThe given pie chart shows the percentage distribution of 450 employees in an organization. Study the pie chart and answer the questions that follow
दिए गए पाई चार्ट एक संगठन में 450 कर्मचारियों के प्रतिशत को दर्शाता है। पाई चार्ट का अध्ययन करें और आने वाले प्रश्नों का उत्तर दें।
What is the central angle of the sector representing the number of employees in department A?
विभाग A में कर्मचारियों की संख्या का प्रतिनिधित्व करने वाले क्षेत्र का केंद्रीय कोण क्या है?View SolutionThe following graph shows the sales of cars (in thousands) in four cities in 4 years. Study the graph and answer the questions.
निम्नलिखित आरेख 4 वर्षों में चार शहरों में कारों की बिक्री (हज़ार में) को दर्शाता है। इस आरेख का अध्ययन कीजिए तथा प्रश्नों के उत्तर दीजिए। Which city has the highest percentage of sales, and in which year?
किस शहर की बिक्री का प्रतिशत सबसे अधिक है तथा किस वर्ष में?View SolutionThe following graph shows the sales of cars (in thousands) in four cities in 4 years. Study the graph and answer the questions.
निम्नलिखित आरेख 4 वर्षों में चार शहरों में कारों की बिक्री (हज़ार में) को दर्शाता है। इस आरेख का अध्ययन कीजिए तथा प्रश्नों के उत्तर दीजिए। In 2019, what is the average number of sales among all the four cities?
2019 में, सभी चार शहरों में औसत बिक्री कितनी रही है?View SolutionThe following pie chart shows percentage expenditure of a country on different heads. The total expenditure is Rs.1,680 (in billions). Study the chart and answer the questions
निम्नलिखित पाई चार्ट अलग-अलग प्रमुखों पर किसी देश का प्रतिशत व्यय दर्शाता है। कुल खर्च रु1,680 (अरबों में)। चार्ट का अध्ययन करें और प्रश्नों का उत्तर दें |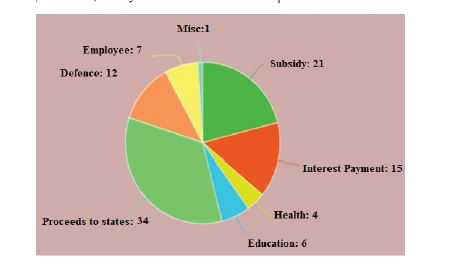 The central angle of the sector representing expenditure on subsidy is :
सब्सिडी पर व्यय का प्रतिनिधित्व करने वाले क्षेत्र का केंद्रीय कोण ज्ञात करे |View SolutionThe sub divided bar diagram given below depicts the result of class XII students of a school for three years. Study the diagram and answer the questions given below.
निम्नलिखित दण्ड आरेख तीन वर्षों के लिए एक स्कूल के कक्षा XII के छात्रों का परीक्षा परिणाम दिखाता है। दण्ड आरेख का अध्ययन कीजिए और निम्नलिखित प्रश्नों का उत्तर दीजिए :
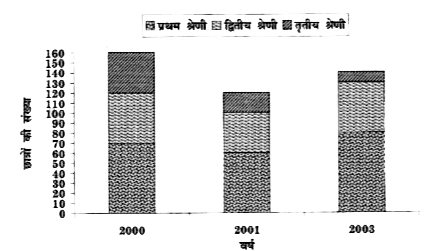
The number of students passed with Third class in the year 2002 is.
वर्ष 2002 में तृतीय श्रेणी में उत्तीर्ण छात्रों की संख्या हैView SolutionThe sub divided bar diagram given below depicts the result of class XII students of a school for three years. Study the diagram and answer the questions given below.
निम्नलिखित दण्ड आरेख तीन वर्षों के लिए एक स्कूल के कक्षा XII के छात्रों का परीक्षा परिणाम दिखाता है। दण्ड आरेख का अध्ययन कीजिए और निम्नलिखित प्रश्नों का उत्तर दीजिए :
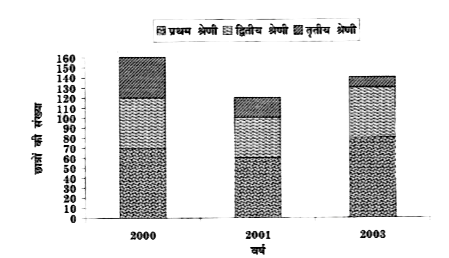
The number of students passed with Second class in the year 2002 is.
वर्ष 2002 में द्वितीय श्रेणी में उत्तीर्ण छात्रों की संख्या हैView SolutionThe following table represents the number of candidates that appeared and qualified in a competitive examination from different states over five years. Study the table and answer the questions that follow.
निम्नलिखित तालिका उन उम्मीदवारों की संख्या को दर्शाती है जो पाँच वर्षों के दौरान विभिन्न राज्यों से किसी प्रतियोगी परीक्षा में शामिल हुए तथा सफल हुए | इस तालिका का अध्ययन कीजिए तथा फिर पूछे गए प्रश्नों के उत्तर दीजिए | What was the total number of candidates appearing from all the states in the year 1997?
वर्ष 1997 में सभी राज्यों से शामिल होने वाले उम्मीदवारों की कुल संख्या कितनी है ?View SolutionThe pie-chart shows percentage-wise distribution of teachers who teach six different subjects. Study the pie chart and answer the questions
पाई-चार्ट छह अलग-अलग विषयों को पढ़ाने वाले शिक्षकों के प्रतिशत को दर्शाता है। पाई चार्ट का अध्ययन करें और प्रश्नों के उत्तर दें।
Total number of teachers = 1650 शिक्षकों की कुल संख्या - 1650
What is the total number of teachers teaching English, Maths and Physics?
अंग्रेजी, गणित और भौतिकी पढ़ाने वाले शिक्षकों की कुल संख्या क्या है?View SolutionThe given pie chart shows the percentage distribution of 450 employees in an organization. Study the pie chart and answer the questions that follow
दिए गए पाई चार्ट एक संगठन में 450 कर्मचारियों के प्रतिशत को दर्शाता है। पाई चार्ट का अध्ययन करें और आने वाले प्रश्नों का उत्तर दें।
If 75% of the employees in department D are males, how many female employees are there in that department ?
यदि विभाग D में 75% कर्मचारी पुरुष हैं, तो उस विभाग में कितनी महिला कर्मचारी हैंView Solution

