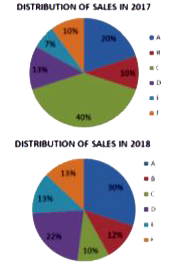
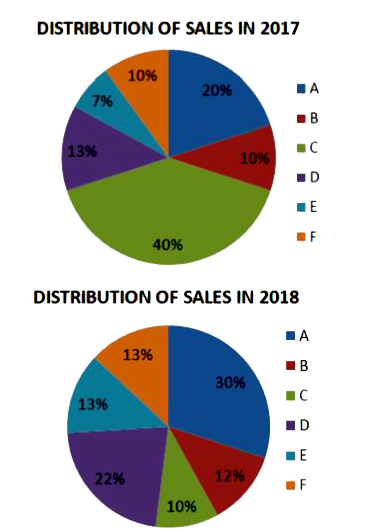
The pie charts show the market share of the companies in the detergent market in 2017 and 2018. The total size of the market has decreased from ₹ 300 crores to ₹ 200 crores. What is the decrease in the sales of Company F?
The correct Answer is:D
Step by step video & image solution for The pie charts show the market share of the companies in the detergent market in 2017 and 2018. The total size of the market has decreased from ₹ 300 crores to ₹ 200 crores. What is the decrease in the sales of Company F? by Maths experts to help you in doubts & scoring excellent marks in Class 14 exams.
Updated on:21/07/2023Similar Questions
The pie charts show the market share of the companies in the detergent market in 2017 and 2018. The total size of the market has decreased from Rs. 300 crores to Rs. 200 crores. What is the decrease in the sales of Company F ?
View SolutionThe following pie-chart shows the market share of four companies S, T, U and V. Total market is worth Rs.72 crores. Study the pie-chart and answer the questions
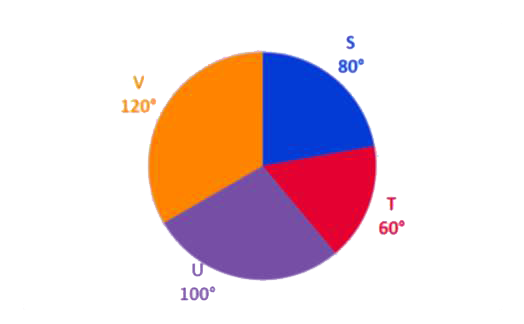
The company having maximum market share is
View Solution
Knowledge Check
The following pie-chart shows the market share of four companies S, T, U and V. Total market is worth Rs. 72 crores. Study the pie-chart and answer the questions.
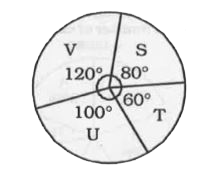
The difference of market shares of companies V and U isARs. 8 croresBRs. 9 croresCRs. 6 croresDRs. 4 croresThe two pie charts show the market share of different companies which produces TV and Refrigerator (noth) in the first quarter of 2005-06.
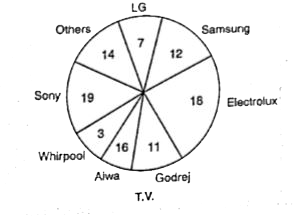
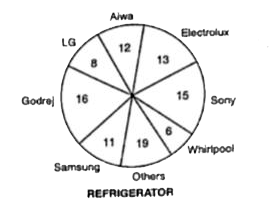
The difference is not shown to scale.A7.2∘B14.4∘C21.6∘Dnone of theseThe line chart given below shows the profit (in crores) of a company for the years 2008 to 2015.
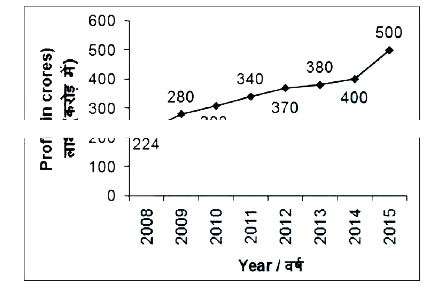
What is the average profit per year from 2011 to 2015 ?Aa. 398Bb. 406Cc. 384Dd. 387
The following pie chart shows the expenditure (in percentage) of the five companies P,Q,R,S and T in the year 2016 .
Total Expenditure = Rs. 48 crores
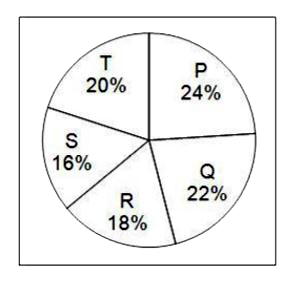
What was the total expenditure (in Rs crores) of the company Q, R and P together?
View SolutionThe following pie-chart shows the market share of four companies S, T, U and V. Total market is worth Rs. 72 crores. Study the pie-chart and answer the questions.
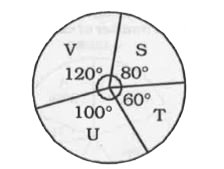
The company having maximum market share is
View SolutionThe given bar chart shows the details of cycle sales by a company between January and May for years 2017 and 2018.
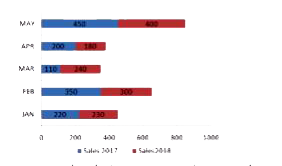
In the given bar-chart, what is the total increase or decrease in percentage sale in 2018?
View SolutionThe line chart given below shows the sales (in crores) of a company for the years 2009 to 2016
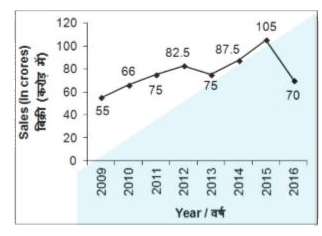
What is the average sale of the company from year 2009 to 2015?
View SolutionThe two pie charts show the market share of different companies which produces TV and Refrigerator (noth) in the first quarter of 2005-06.
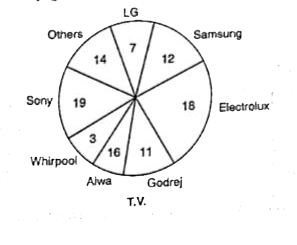
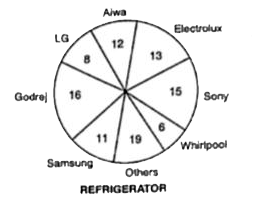
Which of the following cann't be deduced from the given data :
View Solution