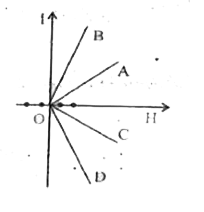
The intensity of magnetization of the magnetic fields graph for a diamagnetic material is best represented by.
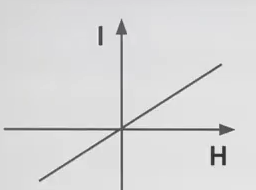
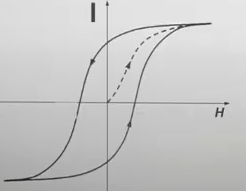
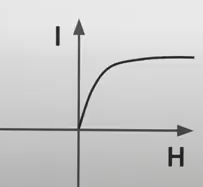
To solve the problem regarding the intensity of magnetization of a diamagnetic material and how it is represented graphically, we can follow these steps:
Step 1: Understand Diamagnetism
Diamagnetic materials are characterized by their negative susceptibility to magnetic fields. This means that when an external magnetic field is applied, these materials develop a magnetization that opposes the applied field.
Step 2: Define Intensity of Magnetization (I)
The intensity of magnetization (I) is defined as the magnetic moment per unit volume of the material. For diamagnetic materials, this intensity is inversely related to the applied magnetic field (H).
Step 3: Relationship Between I and H
For diamagnetic materials, the relationship between intensity of magnetization (I) and the magnetic field (H) can be expressed as:
I=−χmH
where χm is the magnetic susceptibility, which is negative for diamagnetic materials.
Step 4: Graphical Representation
1. When the magnetic field (H) is positive, the intensity of magnetization (I) will be negative.
2. When the magnetic field (H) is negative, the intensity of magnetization (I) will be positive.
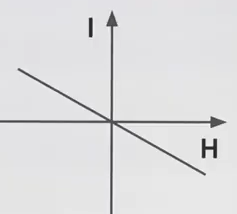
3. This leads to a linear relationship where the graph will be a straight line passing through the origin but in opposite quadrants.
Step 5: Conclusion
The graph representing the intensity of magnetization (I) versus the magnetic field (H) for a diamagnetic material will be a straight line with a negative slope. It will lie in the second and fourth quadrants of the Cartesian plane.
Final Representation
Thus, the best representation of the graph for the intensity of magnetization of a diamagnetic material is a straight line that slopes downwards from the second quadrant to the fourth quadrant.
---
Diamagnetic materials are characterized by their negative susceptibility to magnetic fields. This means that when an external magnetic field is applied, these materials develop a magnetization that opposes the applied field.
The intensity of magnetization (I) is defined as the magnetic moment per unit volume of the material. For diamagnetic materials, this intensity is inversely related to the applied magnetic field (H).
For diamagnetic materials, the relationship between intensity of magnetization (I) and the magnetic field (H) can be expressed as:
I=−χmH
where χm is the magnetic susceptibility, which is negative for diamagnetic materials.
1. When the magnetic field (H) is positive, the intensity of magnetization (I) will be negative.
2. When the magnetic field (H) is negative, the intensity of magnetization (I) will be positive.
3. This leads to a linear relationship where the graph will be a straight line passing through the origin but in opposite quadrants.
The graph representing the intensity of magnetization (I) versus the magnetic field (H) for a diamagnetic material will be a straight line with a negative slope. It will lie in the second and fourth quadrants of the Cartesian plane.
Thus, the best representation of the graph for the intensity of magnetization of a diamagnetic material is a straight line that slopes downwards from the second quadrant to the fourth quadrant.
Similar Questions
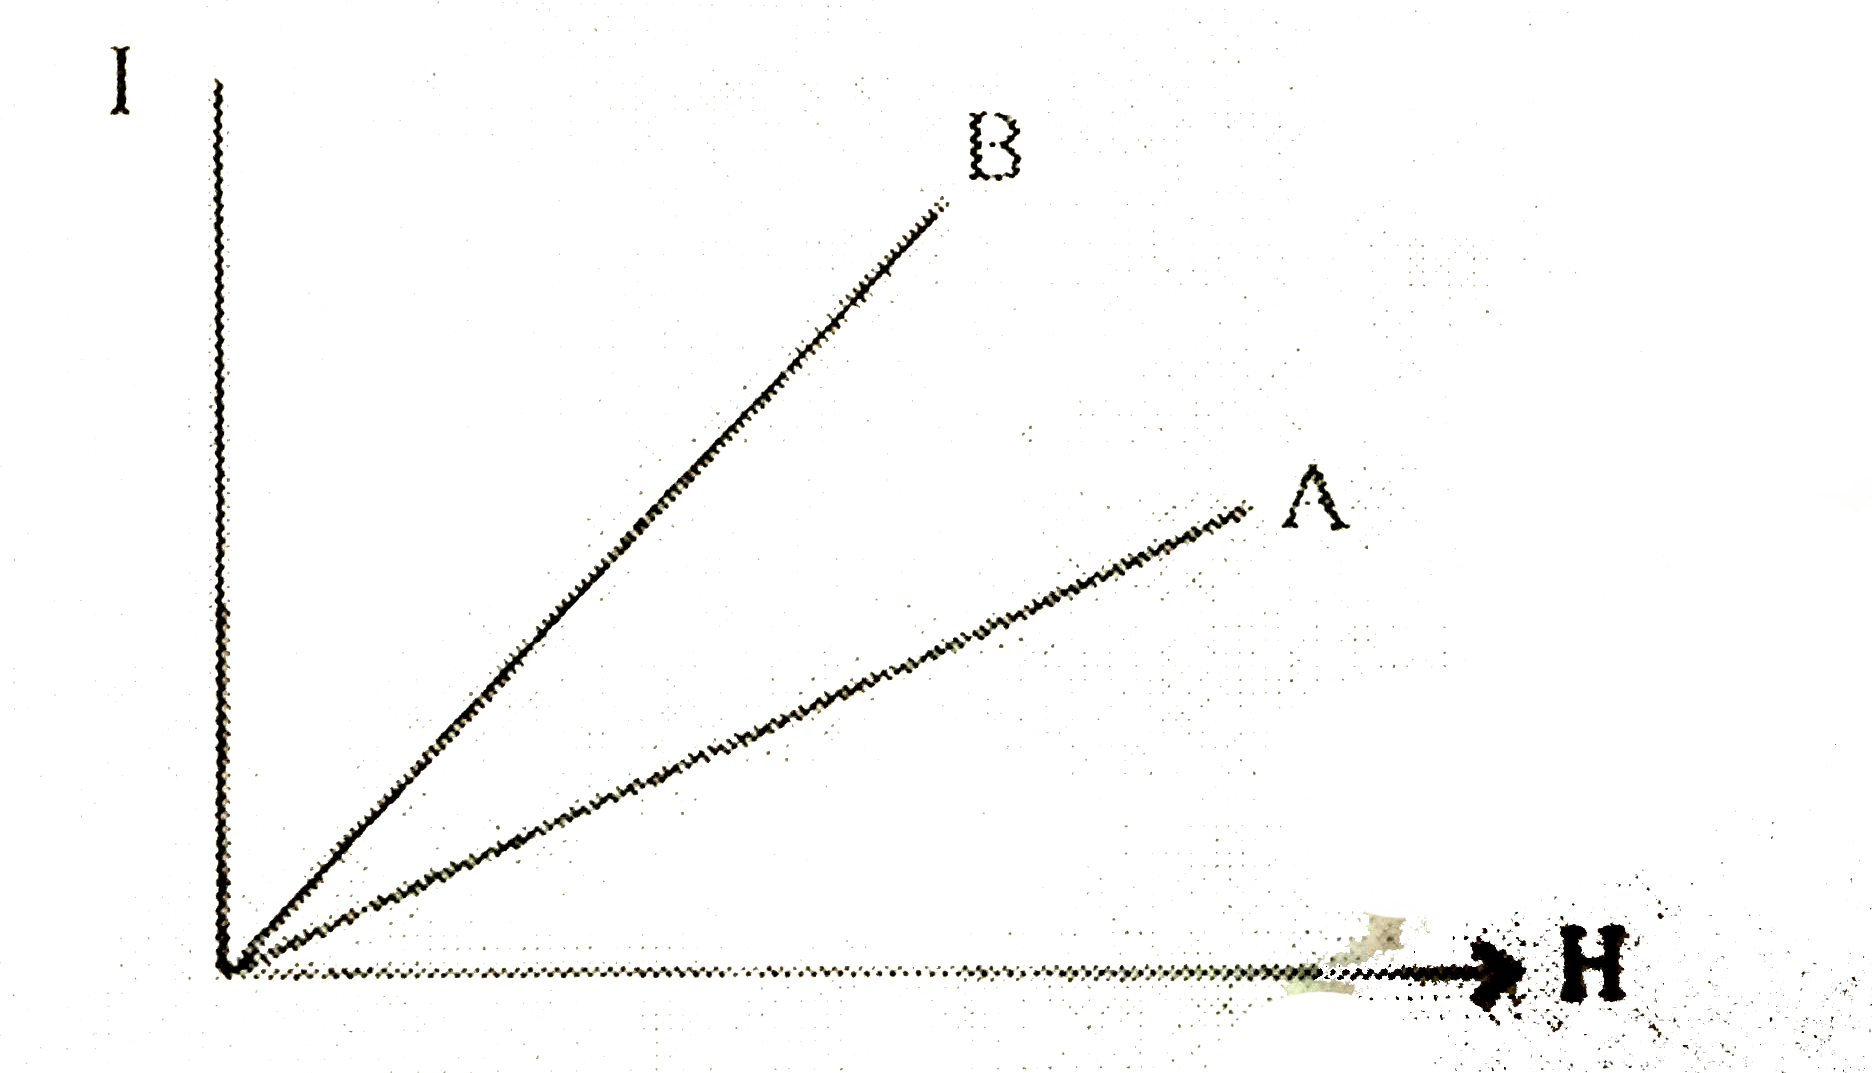
The following figure shows the variation of intensity of magnetisation versus the applied magnetic field intensity, H, for two magnetic materials A and B :
(a) Identify the materials A and B.
(b) Why does the material B, have a larger susceptibility than A, for a given field at constant temperature?
View SolutionThe magnetic field lines are by a diamagnetic substance.
View Solution
Knowledge Check
A uniform magnetic field is represented by
Aparallel and equidistant field linesBnon parallel but equidistant field linesCperpendicular linesDcurved linesThe ratio of magnetisation I to the magnetic field intensity H is
ASusceptibilityBPermeabilityCPermittivityDAll of thoseThe variation of magnetic susceptibility (x) with temperature (T) for a diamagnetic material is best represented by
A B
B C
C D
D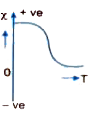
The following figure shows the variation of intensity of magnetisation I versus the applied magnetic field intensity H, for two magnetic materials A and B
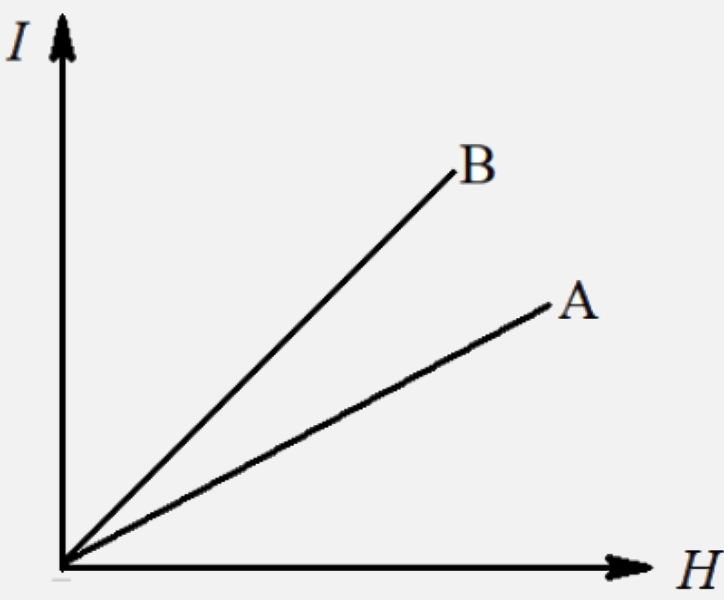
Which of the material have a larger susceptibility for a given field at constant temperature?
View SolutionIn a non-uniform magnetic field a diamagnetic material moves
View SolutionThe ratio of magnetisation I to the magnetic field intensity H is
View SolutionA uniform magnetic field is represented by -
View SolutionThe variation of the intensity of magnetization (I) with respect to the magnetizing field (H) in a diamagnetic substance is described by the .
View Solution
