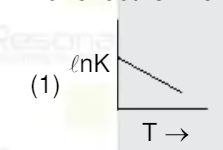
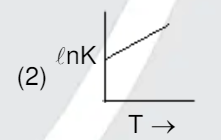
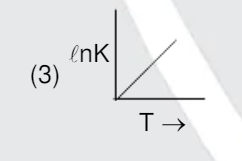
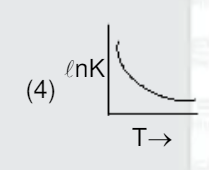
For endothermic reaction which is correct graph


To solve the question regarding the correct graph for an endothermic reaction, we need to analyze the relationship between the natural logarithm of the equilibrium constant (ln K) and the inverse of temperature (1/T). Here's a step-by-step breakdown of the solution:
Step 1: Understand the relationship between Gibbs Free Energy and Equilibrium Constant
We start with the equation for Gibbs Free Energy (ΔG):
ΔG=−RTlnK
where:
- R is the universal gas constant,
- T is the temperature in Kelvin,
- K is the equilibrium constant.
Step 2: Relate Gibbs Free Energy to Enthalpy and Entropy
From thermodynamics, we know:
ΔG=ΔH−TΔS
where:
- ΔH is the change in enthalpy,
- ΔS is the change in entropy.
Step 3: Equate the two expressions for ΔG
By equating the two expressions for ΔG, we have:
−RTlnK=ΔH−TΔS
Step 4: Rearrange the equation for ln K
Rearranging the equation gives us:
lnK=−ΔHRT+ΔSR
This shows that lnK is a linear function of 1T.
Step 5: Identify the slope and intercept
From the equation lnK=−ΔHR⋅1T+ΔSR, we can identify:
- The slope m=−ΔHR (which is negative for endothermic reactions since ΔH>0),
- The y-intercept c=ΔSR.
Step 6: Draw the graph
Since the slope is negative, the graph of lnK versus 1T will be a straight line that decreases as 1T increases.
Conclusion
The correct graph for an endothermic reaction is a straight line with a negative slope when plotting lnK against 1T.
---
We start with the equation for Gibbs Free Energy (ΔG):
ΔG=−RTlnK
where:
- R is the universal gas constant,
- T is the temperature in Kelvin,
- K is the equilibrium constant.
From thermodynamics, we know:
ΔG=ΔH−TΔS
where:
- ΔH is the change in enthalpy,
- ΔS is the change in entropy.
By equating the two expressions for ΔG, we have:
−RTlnK=ΔH−TΔS
Rearranging the equation gives us:
lnK=−ΔHRT+ΔSR
This shows that lnK is a linear function of 1T.
From the equation lnK=−ΔHR⋅1T+ΔSR, we can identify:
- The slope m=−ΔHR (which is negative for endothermic reactions since ΔH>0),
- The y-intercept c=ΔSR.
Since the slope is negative, the graph of lnK versus 1T will be a straight line that decreases as 1T increases.
The correct graph for an endothermic reaction is a straight line with a negative slope when plotting lnK against 1T.
Topper's Solved these Questions
- JEE MAIN 2021BOOK - JEE MAINS PREVIOUS YEARCHAPTER - JEE MAIN 2021EXERCISE - SECTION-A
100 Videos
- JEE MAIN 2021BOOK - JEE MAINS PREVIOUS YEARCHAPTER - JEE MAIN 2021EXERCISE - SECTION-B
50 Videos
- JEE MAINBOOK - JEE MAINS PREVIOUS YEARCHAPTER - JEE MAINEXERCISE - CHEMISTRY
150 Videos
- JEE MAIN 2022BOOK - JEE MAINS PREVIOUS YEARCHAPTER - JEE MAIN 2022EXERCISE - Question
561 Videos
Similar Questions
Knowledge Check
In endothermic reaction
AThe enthalpy of reactions is more than that of productsBHeat is given to the surroundingsCΔH is negative valueDΔH has positive valueIn endothermic reaction
Athe enthalpy ofreactants is more than that of productsBheat is given to the surroundingsCΔH has a positive valueDΔU has a negative valueIn endothermic reaction
AHeat evolved is given positive signBChange in enthalpy is given negative signCHeat absorbed is given negative signDNone of these
For an endothermic reaction,
View SolutionIn endothermic reactions,
View SolutionIn an endothermic reaction
View SolutionFor an endothermic reaction which is non-spontaneous at 0 °C and becomes feasible at 100 °C, which of the following is correct regarding enthalpy and entropy ?
View SolutionIn endothermic reactions, the reactants
View Solution
