Comprehension:
The following table represents the number of items sold by four divisions of a consumer goods dealer durrng 2010 to 2013.
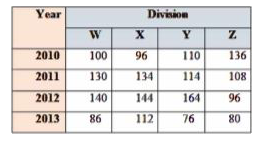
What is the average number of items sold by division W during the four years?
A
116. 5
B
118
C
114
D
121.5
Video Solution
Text Solution
The correct Answer is:C
|
Answer
Step by step video, text & image solution for Comprehension: The following table represents the number of items sold by four divisions of a consumer goods dealer durrng 2010 to 2013. What is the average number of items sold by division W during the four years? by Maths experts to help you in doubts & scoring excellent marks in Class 14 exams.
Updated on:21/07/2023
Knowledge Check
- Question 1 - Select One
Comprehension:
The following table represents the number of items sold by four divisions of a consumer goods dealer durrng 2010 to 2013.
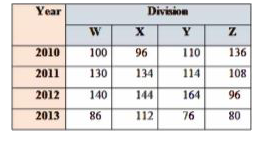
What is the ratio of total number of items sold by Y in 2012 and 2013 to that of Z in the same period?A15:11B11:16C11:15D16:11 - Question 1 - Select One
Comprehension:
The following table represents the number of items sold by four divisions of a consumer goods dealer durrng 2010 to 2013.
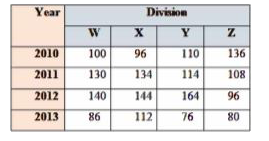
During 2011, which division performed better comparatively?AXBZCYDW - Question 1 - Select One
Comprehension:
The following table represents the number of items sold by four divisions of a consumer goods dealer durrng 2010 to 2013.
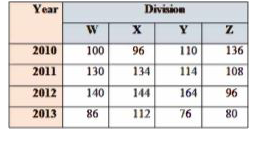
The combined sales figures in 2011 and 2013 of which division was the lmvest?AA. YBB. WCC. ZDD. X - Question 1 - Select One
What was the average number of cars sold by A during Feb-Apr 2016
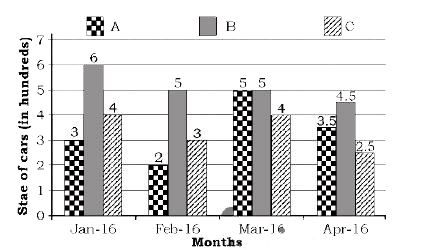 A375B350C250D300
 - Question 1 - Select One
The table shows the number of cars sold by three showrooms over a period of six years.
यह तालिका तीन शोरूम द्वारा छः वर्षों की अवधि में बेची गयी कारों की संख्या दर्शाती है |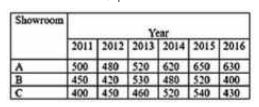 What is the average number of cars sold by showroom A over the given six years (nearest to one decimal place)?
दिए गए छः वर्षों में शोरूम A द्वारा बेची गयी कारों की औसत संख्या कितनी है ? (एक दशमलव स्थान के निकटतम )A586.7B566.7C594.7D592.7 - Question 1 - Select One
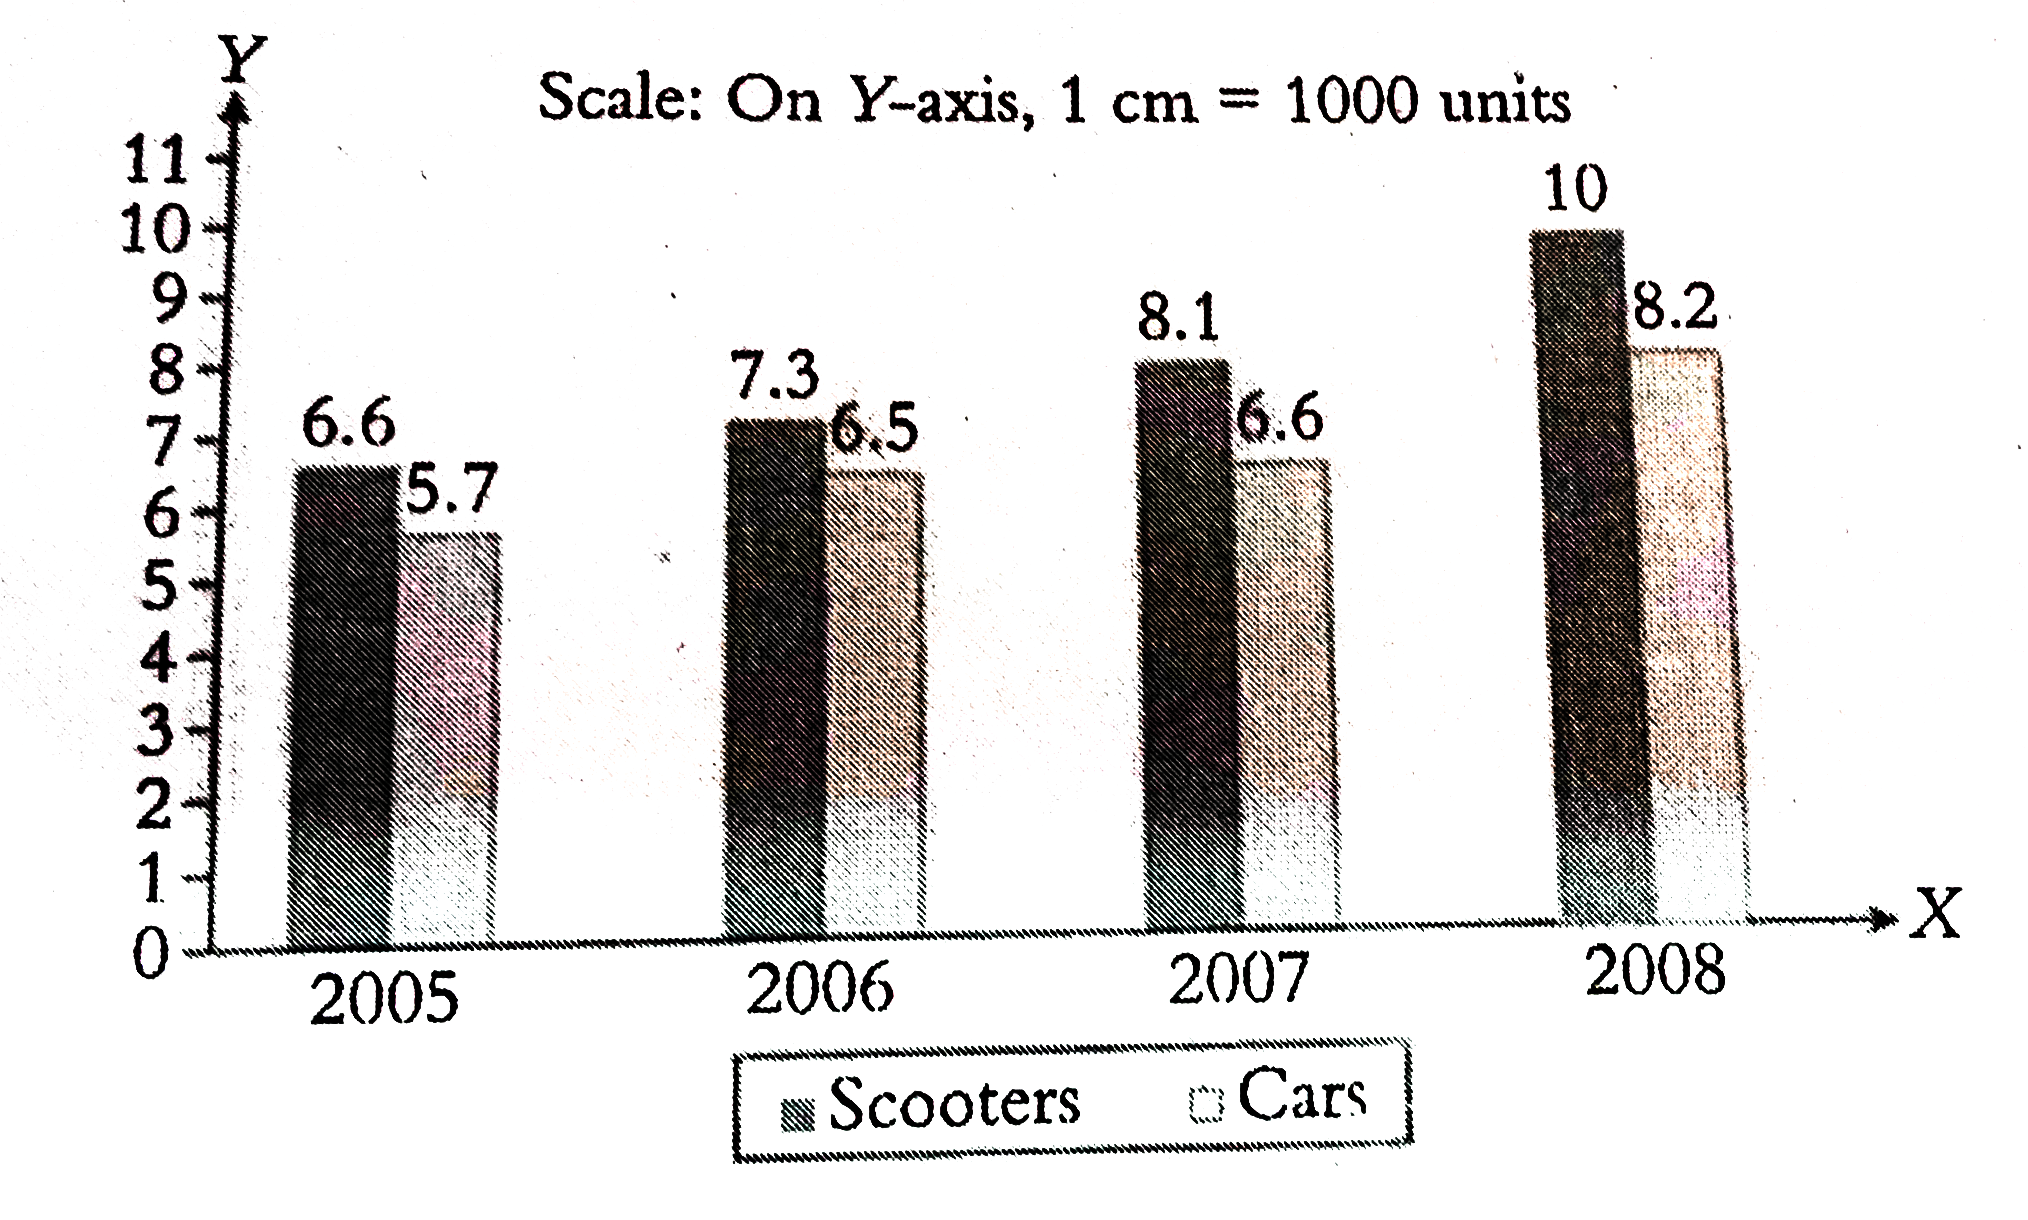
Find the total number of scooters sold in the four years.A26000B27000C31000D32000 - Question 1 - Select One
The following table shows the items of expenditure of a company (in ₹ lakh per annum), from 2015 to 2019.
निम्नलिखित तालिका 2015-2019 तक एक कंपनी के व्यय की मदों को ( लाख रुपये प्रति वर्ष में ) दर्शाती है | What is the average amount of interest per year which the company had to pay during this
period?
इस अवधि के दौरान प्रति वर्ष कंपनी को ब्याज की कितनी औसत राशि का भुगतान करना पड़ा है ?ARs. 35 lakhBRs. 34.7 lakhCRs. 25 lakhDRs. 30.7 lakh - Question 1 - Select One
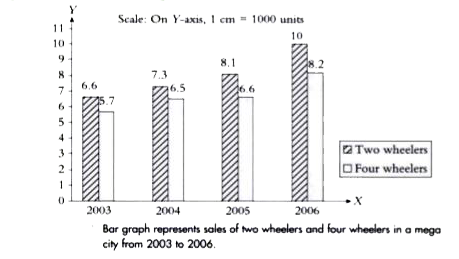
Find the total number of two wheelers sold in four years.A26000B27000C31000D32000 - Question 1 - Select One
The Bar graph given below presents the number of books sold by a bookseller during different months of a year.
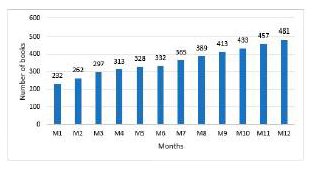
What is the total number of books sold by the bookseller in the year?A4032B4132C4302D4202 - Question 1 - Select One
The following table presents the number of units of a product produced and sold by a company during six years.
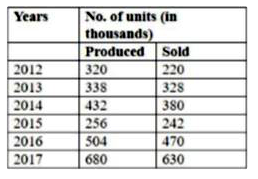
What is the ratio of the total number of units of the product sold in 2013 and 2015 to that prodcued in 2015 and 2016 ?A3:4B7:9C29:38D14:19

