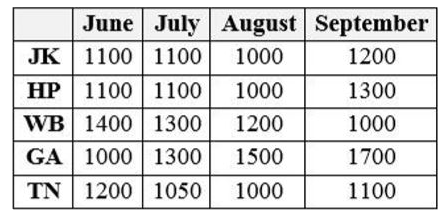
The following table represents the rainfal (in mm) of five states from June to September in a year.
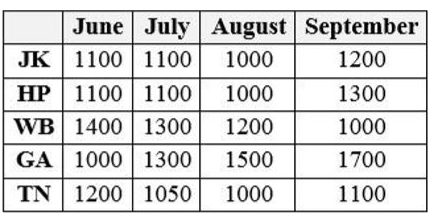
Consider the information and answer questions based on it.
Which state shows a gradual increases in its rainfall from June to September ?
HP
WB
GA
TN
The correct Answer is:A
Similar Questions
The following table represents the percentage marks of four students in six subjects. Consider the table and answer questions based on it.
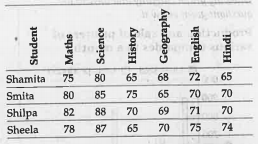
Who has the highest total marks
View SolutionThe following table represents the percentage marks of four students in six subjects. Consider the table and answer questions based on it.
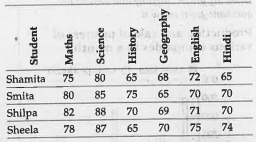
The average marks obtained by the students in Geography and History are
View Solution
Knowledge Check
The following table represents the rainfal (in mm) of five states from June to September in a year.
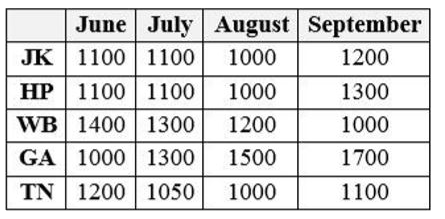
Consider the information and answer questions based on it.
Which state has the lowest average rainfall ?AJKBHPCWBDTNThe following table represents the rainfal (in mm) of five states from June to September in a year.
Consider the information and answer questions based on it.
Which month received the lowest rainfall in the year ?AJuneBJulyCAugustDSeptemberThe following table represent the marks of four students in five subjects.
 Consider the information and answer questions based on it.
Who has the highest average marks?
A. Shyam
B. Sunil
C. Jagdish
D. RajeshACBBCDDA
The following table represents income of a Gram Panchayat from different sources in a particular year:

Draw a bar graph to represent the above information
View SolutionThe following table represent the marks of four students in five subjects.
 Consider the information and answer questions based on it.
Who has the highest marks in History and Geography put together?
A. Shyam
B. Sunil
C. jagdish
D. Rajesh
View SolutionThe following table represent the marks of four students in five subjects.
 Consider the information and answer questions based on it.
The difference between the total marks scored by Sunil and Jagdish is
A. 190
B. 125
C. 105
D. 115
View SolutionStudy the following table and answer the questions based on it. What is the average population of state B (in lakh) for all the years together?
View SolutionStudy the map and answer the following questions:
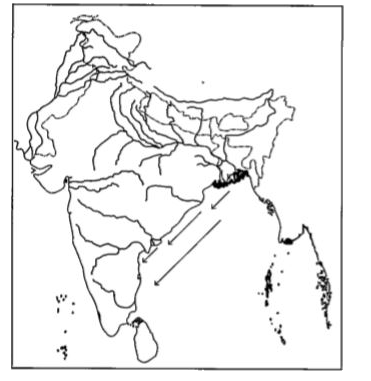
Which of the following regions receives maximum rainfall from these winds?
View Solution
