The table below depicts the Number of Books Sold by 5 cities during 5 months . Study the following table and answer the question .
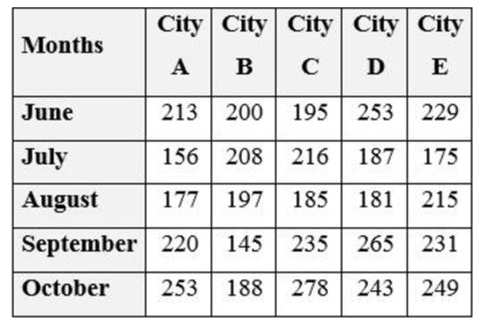
If 30 % of the total number of books sold by City B , D and E together in July were academic books , how many non-academic books were sold by the same Cities together in the same month ?
379
389
399
309
The correct Answer is:C
Step by step video, text & image solution for The table below depicts the Number of Books Sold by 5 cities during 5 months . Study the following table and answer the question . If 30 % of the total number of books sold by City B , D and E together in July were academic books , how many non-academic books were sold by the same Cities together in the same month ? by Maths experts to help you in doubts & scoring excellent marks in Class 14 exams.
Knowledge Check
- Question 1 - Select One
The table below depicts the Number of Books Sold by 5 cities during 5 months . Study the following table and answer the question .
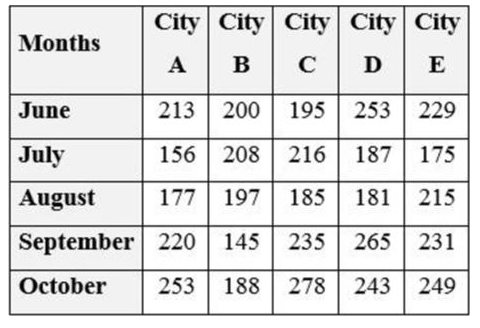
What is the average number of books sold by City C in July , September and October together ?
(a)243
(b)242
(c)234
(d)224A243B242C234D224 - Question 1 - Select One
The table below depicts the Number of Books Sold by 5 cities during 5 months . Study the following table and answer the question .
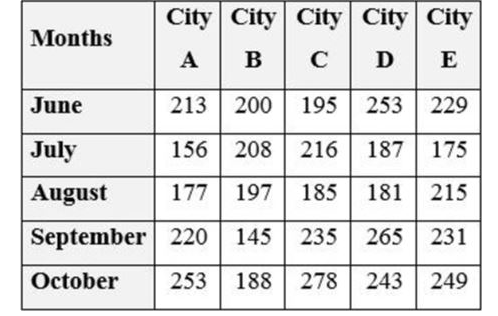
What is the respective ratio between the total number of books sold by City A in July and September together and total number of books sold by City E in August and October together ?
(a)57:49
(b)49:57
(c)58:47
(d)47:58A57:49B49:57C58:47D47:58 - Question 1 - Select One
Study the graph carefully and answer the following questions.
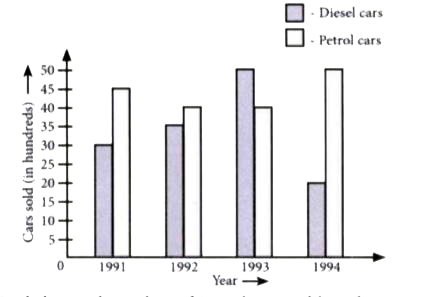
Find the total number of Diesel cars sold in the year 1992 and 1994 together.A2500B5500C1500D4500 - Question 1 - Select One
The Bar graph given below presents the number of books sold by a bookseller during different months of a year.
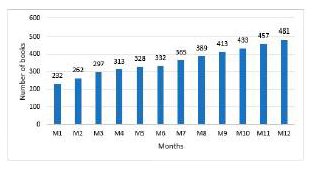
What is the total number of books sold by the bookseller in the year?A4032B4132C4302D4202
Similar Questions
The table below depicts the Number of books Sold by 5 cities during 5 months. Study the following table and answer the questions.
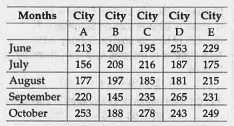
If 30% of the total number of books sold by City B, D and E together in July were academic books, how many non were academic books were sold by the same Cities together in the same month?View SolutionThe table below depicts the Number of books Sold by 5 cities during 5 months. Study the following table and answer the questions.
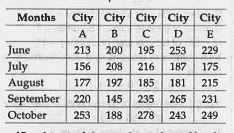
What is the average number of books sold by city C in July, September and October together?View SolutionThe table below depicts the Number of books Sold by 5 cities during 5 months. Study the following table and answer the questions.
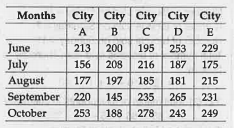
what is the respective ratio between the total number of books sold by City A in July and September together and total number of books sold by City E in August and October together ?View SolutionStudy the following graph and answer the question that follows.
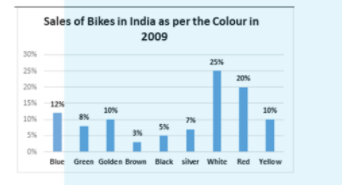
If the total number of bikes sold in 2009 was 10000 how many more yellow bikes were sold than green ones?View SolutionDirection: The following table shows the data of people of five different cities. Study the following table and answer the following questions.
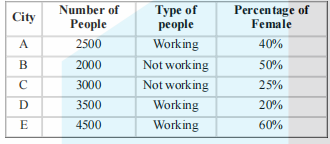
The total number of males who are working out of five cities is-View SolutionRead the bar graph which shows the number of books sold by a bookstore during five consecutive years and answer the following questions
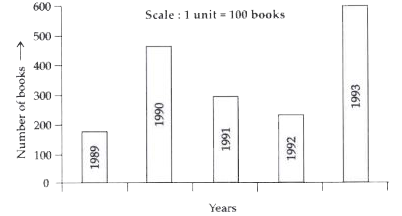
In which years were fewer than 200 books sold ?View Solution

