The table below depicts the Number of Books Sold by 5 cities during 5 months . Study the following table and answer the question .
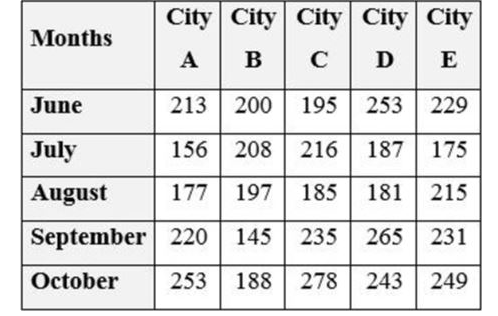
What is the respective ratio between the total number of books sold by City A in July and September together and total number of books sold by City E in August and October together ?
(a)57:49
(b)49:57
(c)58:47
(d)47:58
57:49
49:57
58:47
47:58
The correct Answer is:D
Step by step video, text & image solution for The table below depicts the Number of Books Sold by 5 cities during 5 months . Study the following table and answer the question . What is the respective ratio between the total number of books sold by City A in July and September together and total number of books sold by City E in August and October together ? (a)57 : 49 (b)49 : 57 (c)58 : 47 (d)47 : 58 by Maths experts to help you in doubts & scoring excellent marks in Class 14 exams.
Updated on:21/07/2023Similar Questions
The table below depicts the Number of books Sold by 5 cities during 5 months. Study the following table and answer the questions.
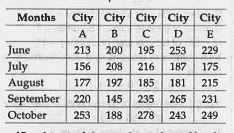
What is the average number of books sold by city C in July, September and October together?
View SolutionThe table below depicts the Number of books Sold by 5 cities during 5 months. Study the following table and answer the questions.
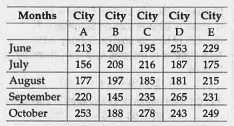
If 30% of the total number of books sold by City B, D and E together in July were academic books, how many non were academic books were sold by the same Cities together in the same month?
View Solution
Knowledge Check
The table below depicts the Number of Books Sold by 5 cities during 5 months . Study the following table and answer the question .
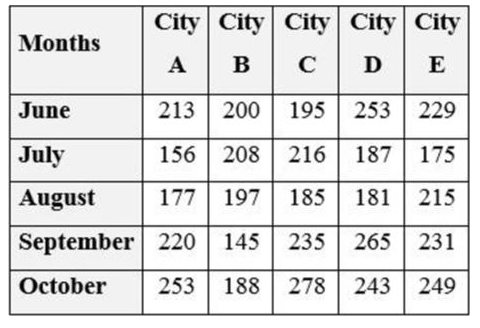
What is the average number of books sold by City C in July , September and October together ?
(a)243
(b)242
(c)234
(d)224A243B242C234D224The table below depicts the Number of Books Sold by 5 cities during 5 months . Study the following table and answer the question .
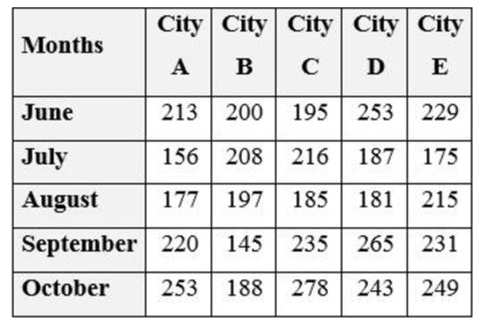
If 30 % of the total number of books sold by City B , D and E together in July were academic books , how many non-academic books were sold by the same Cities together in the same month ?A379B389C399D309The given table represents the sale (in thousands) of cars by four companies A,B,C and D in six years. Study the table and answer the questions that follow:
दी गयी तालिका चार कंपनियों - A, B, C और D के द्वारा छः वर्षों में की गयी कारों की बिक्री ( हज़ार में ) दर्शाती है | इस तालिका का अध्ययन करें तथा फिर पूछे गए प्रश्नों के उत्तर दें |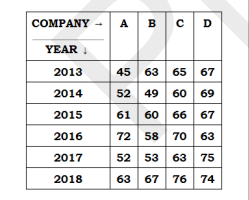 What is the ratio of total number of cars sold by companies A,B and D in 2017 to the total number
of cars sold by all companies in 2018?
कंपनी A, B और D के द्वारा 2017 में बेची गयी कारों की कुल संख्या तथा 2018 में सभी कंपनियों के द्वारा बेची गयी कारों की कुल संख्या के बीच क्या अनुपात है ?A3:4B6:13C9:14D18:23
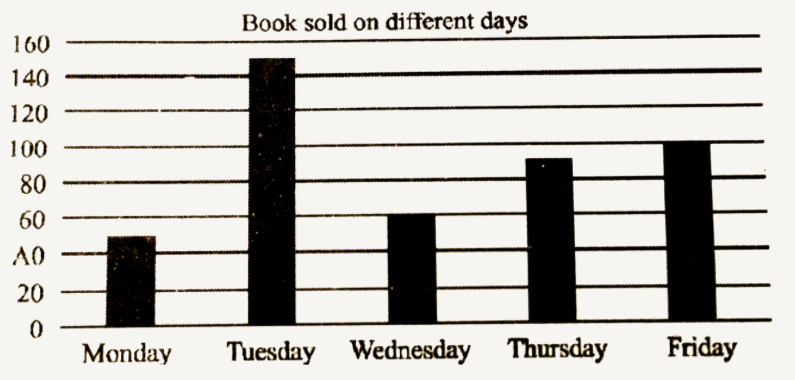
Find the difference between total number of books sold on Monday and Tuesday together to total number of books sold on Thursday and Friday together ?
View Solution
What is the total number of mobile phones sold of company B during Agust and September together ?
View Solution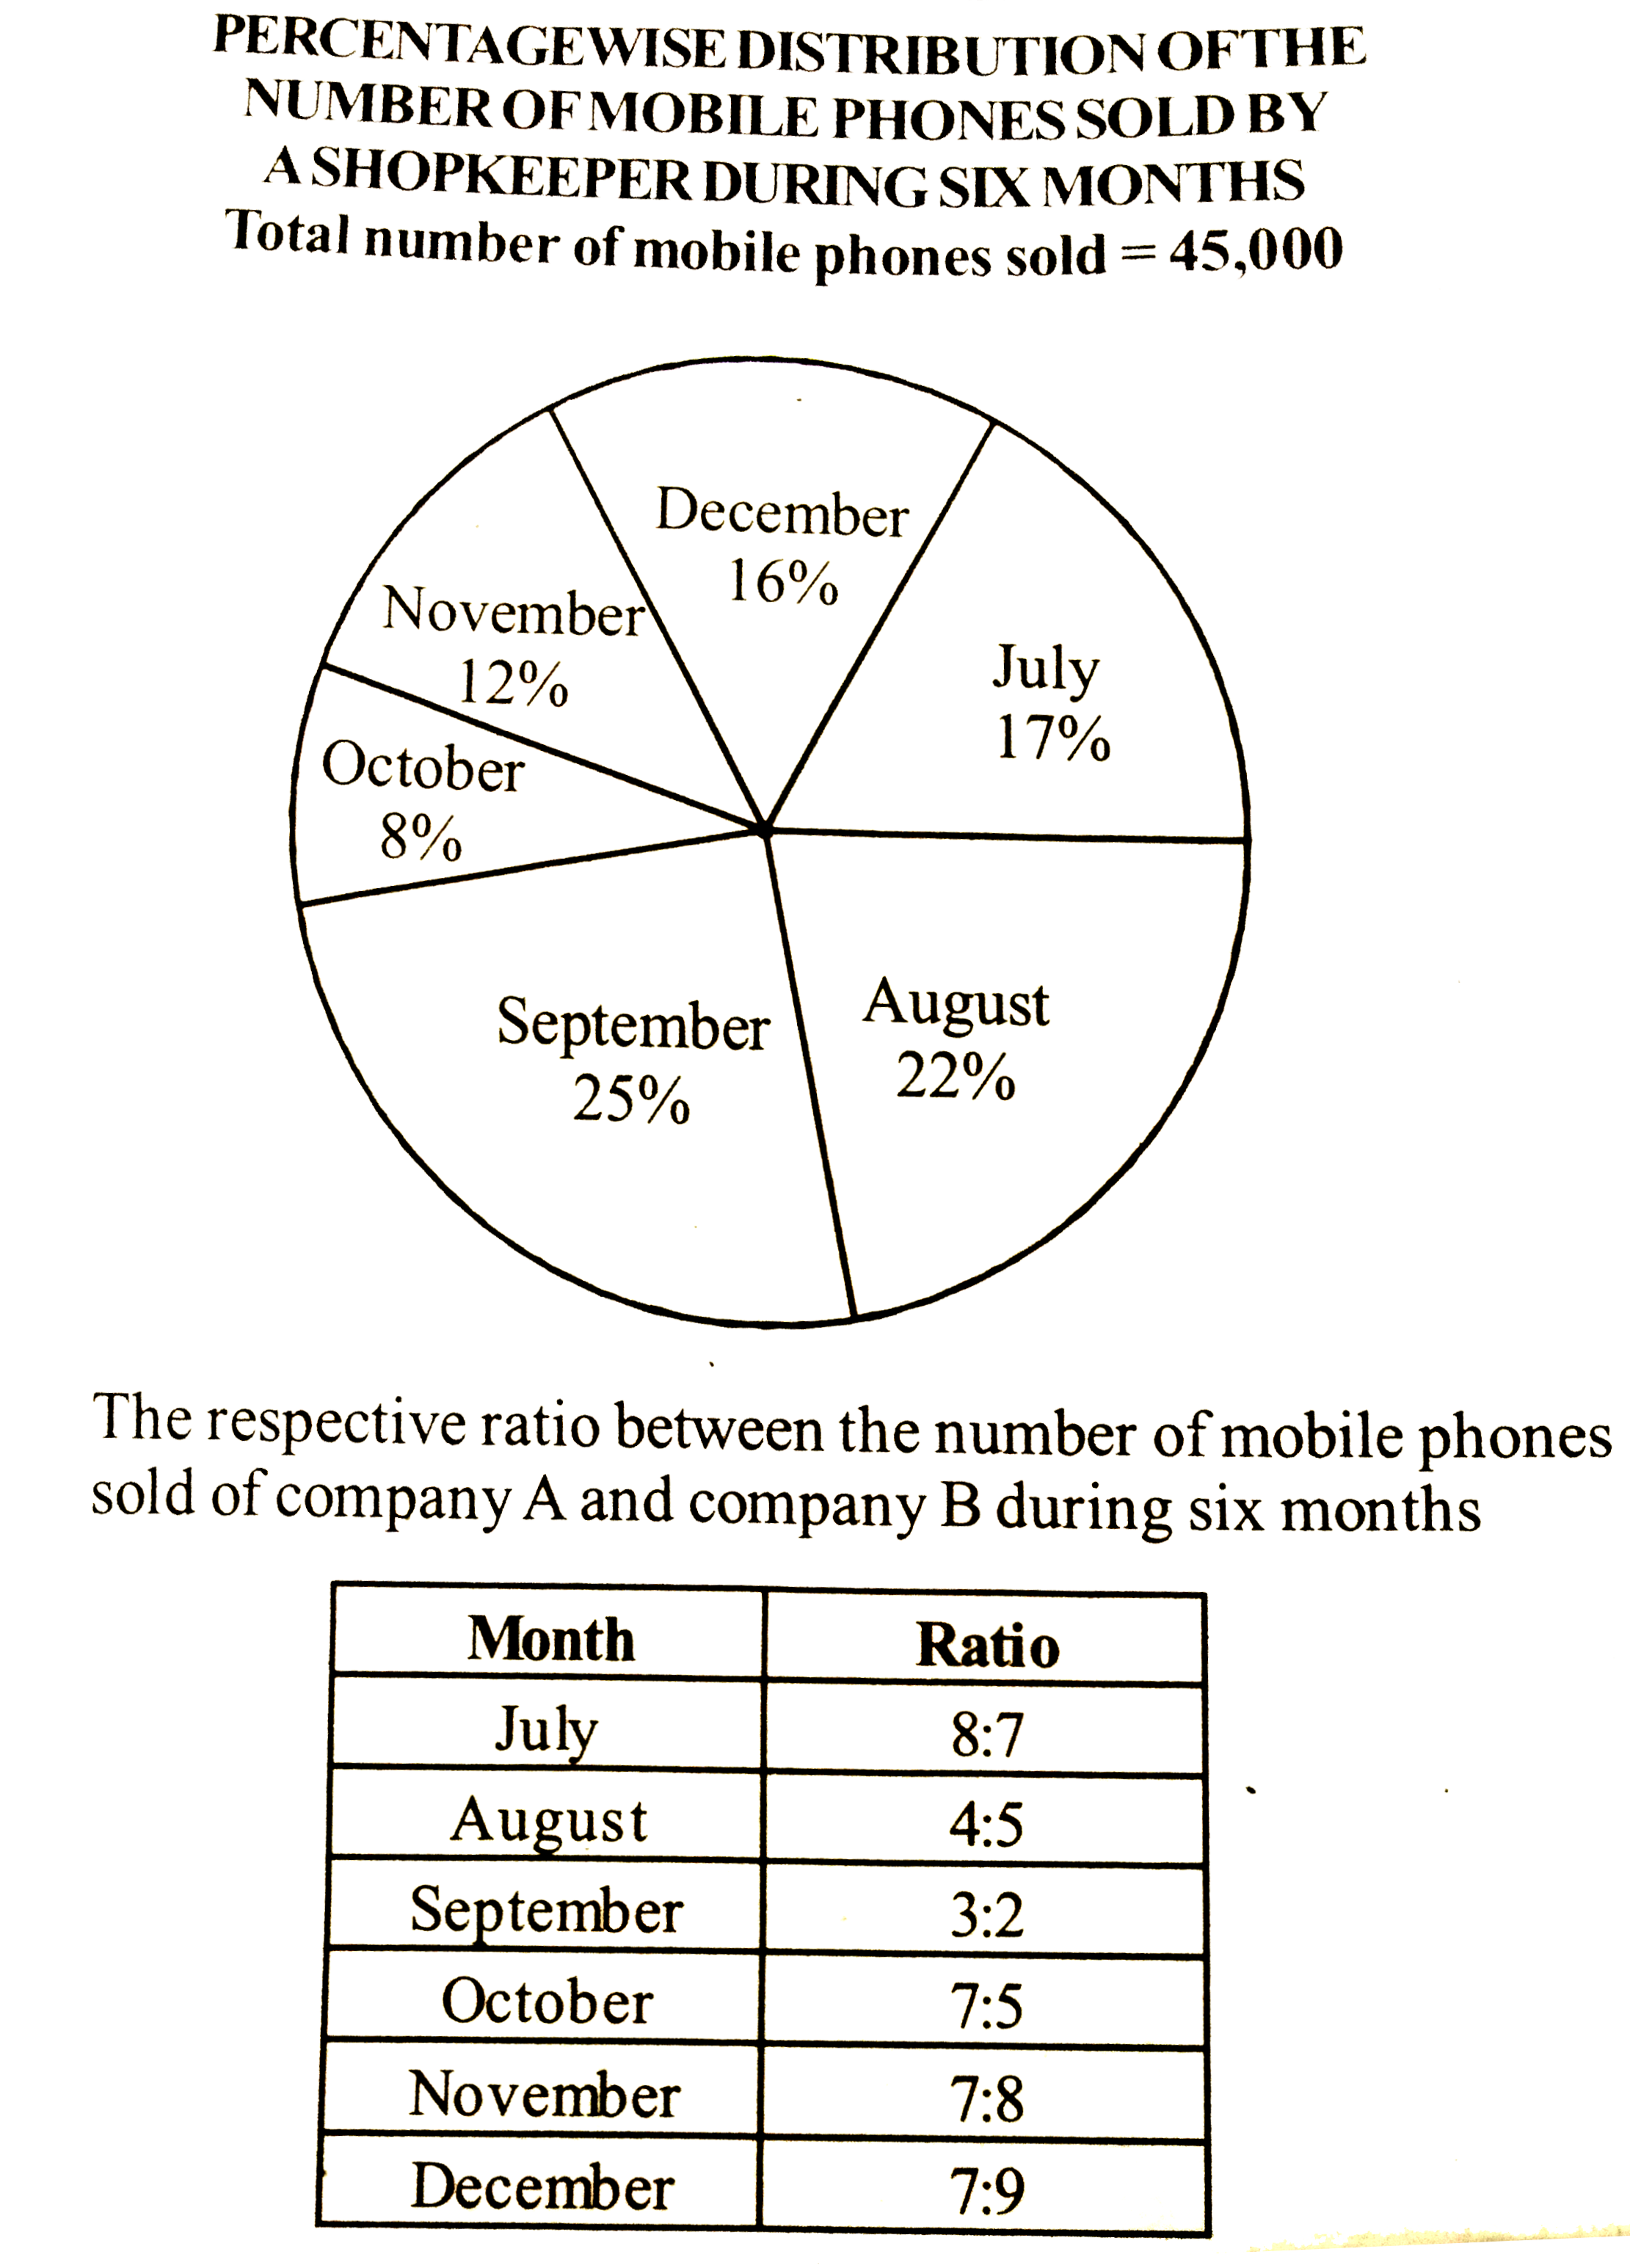
What is the respective ratio between the number of mobile phones sold of company B during July and thoses sold during December of the same company ?
View Solution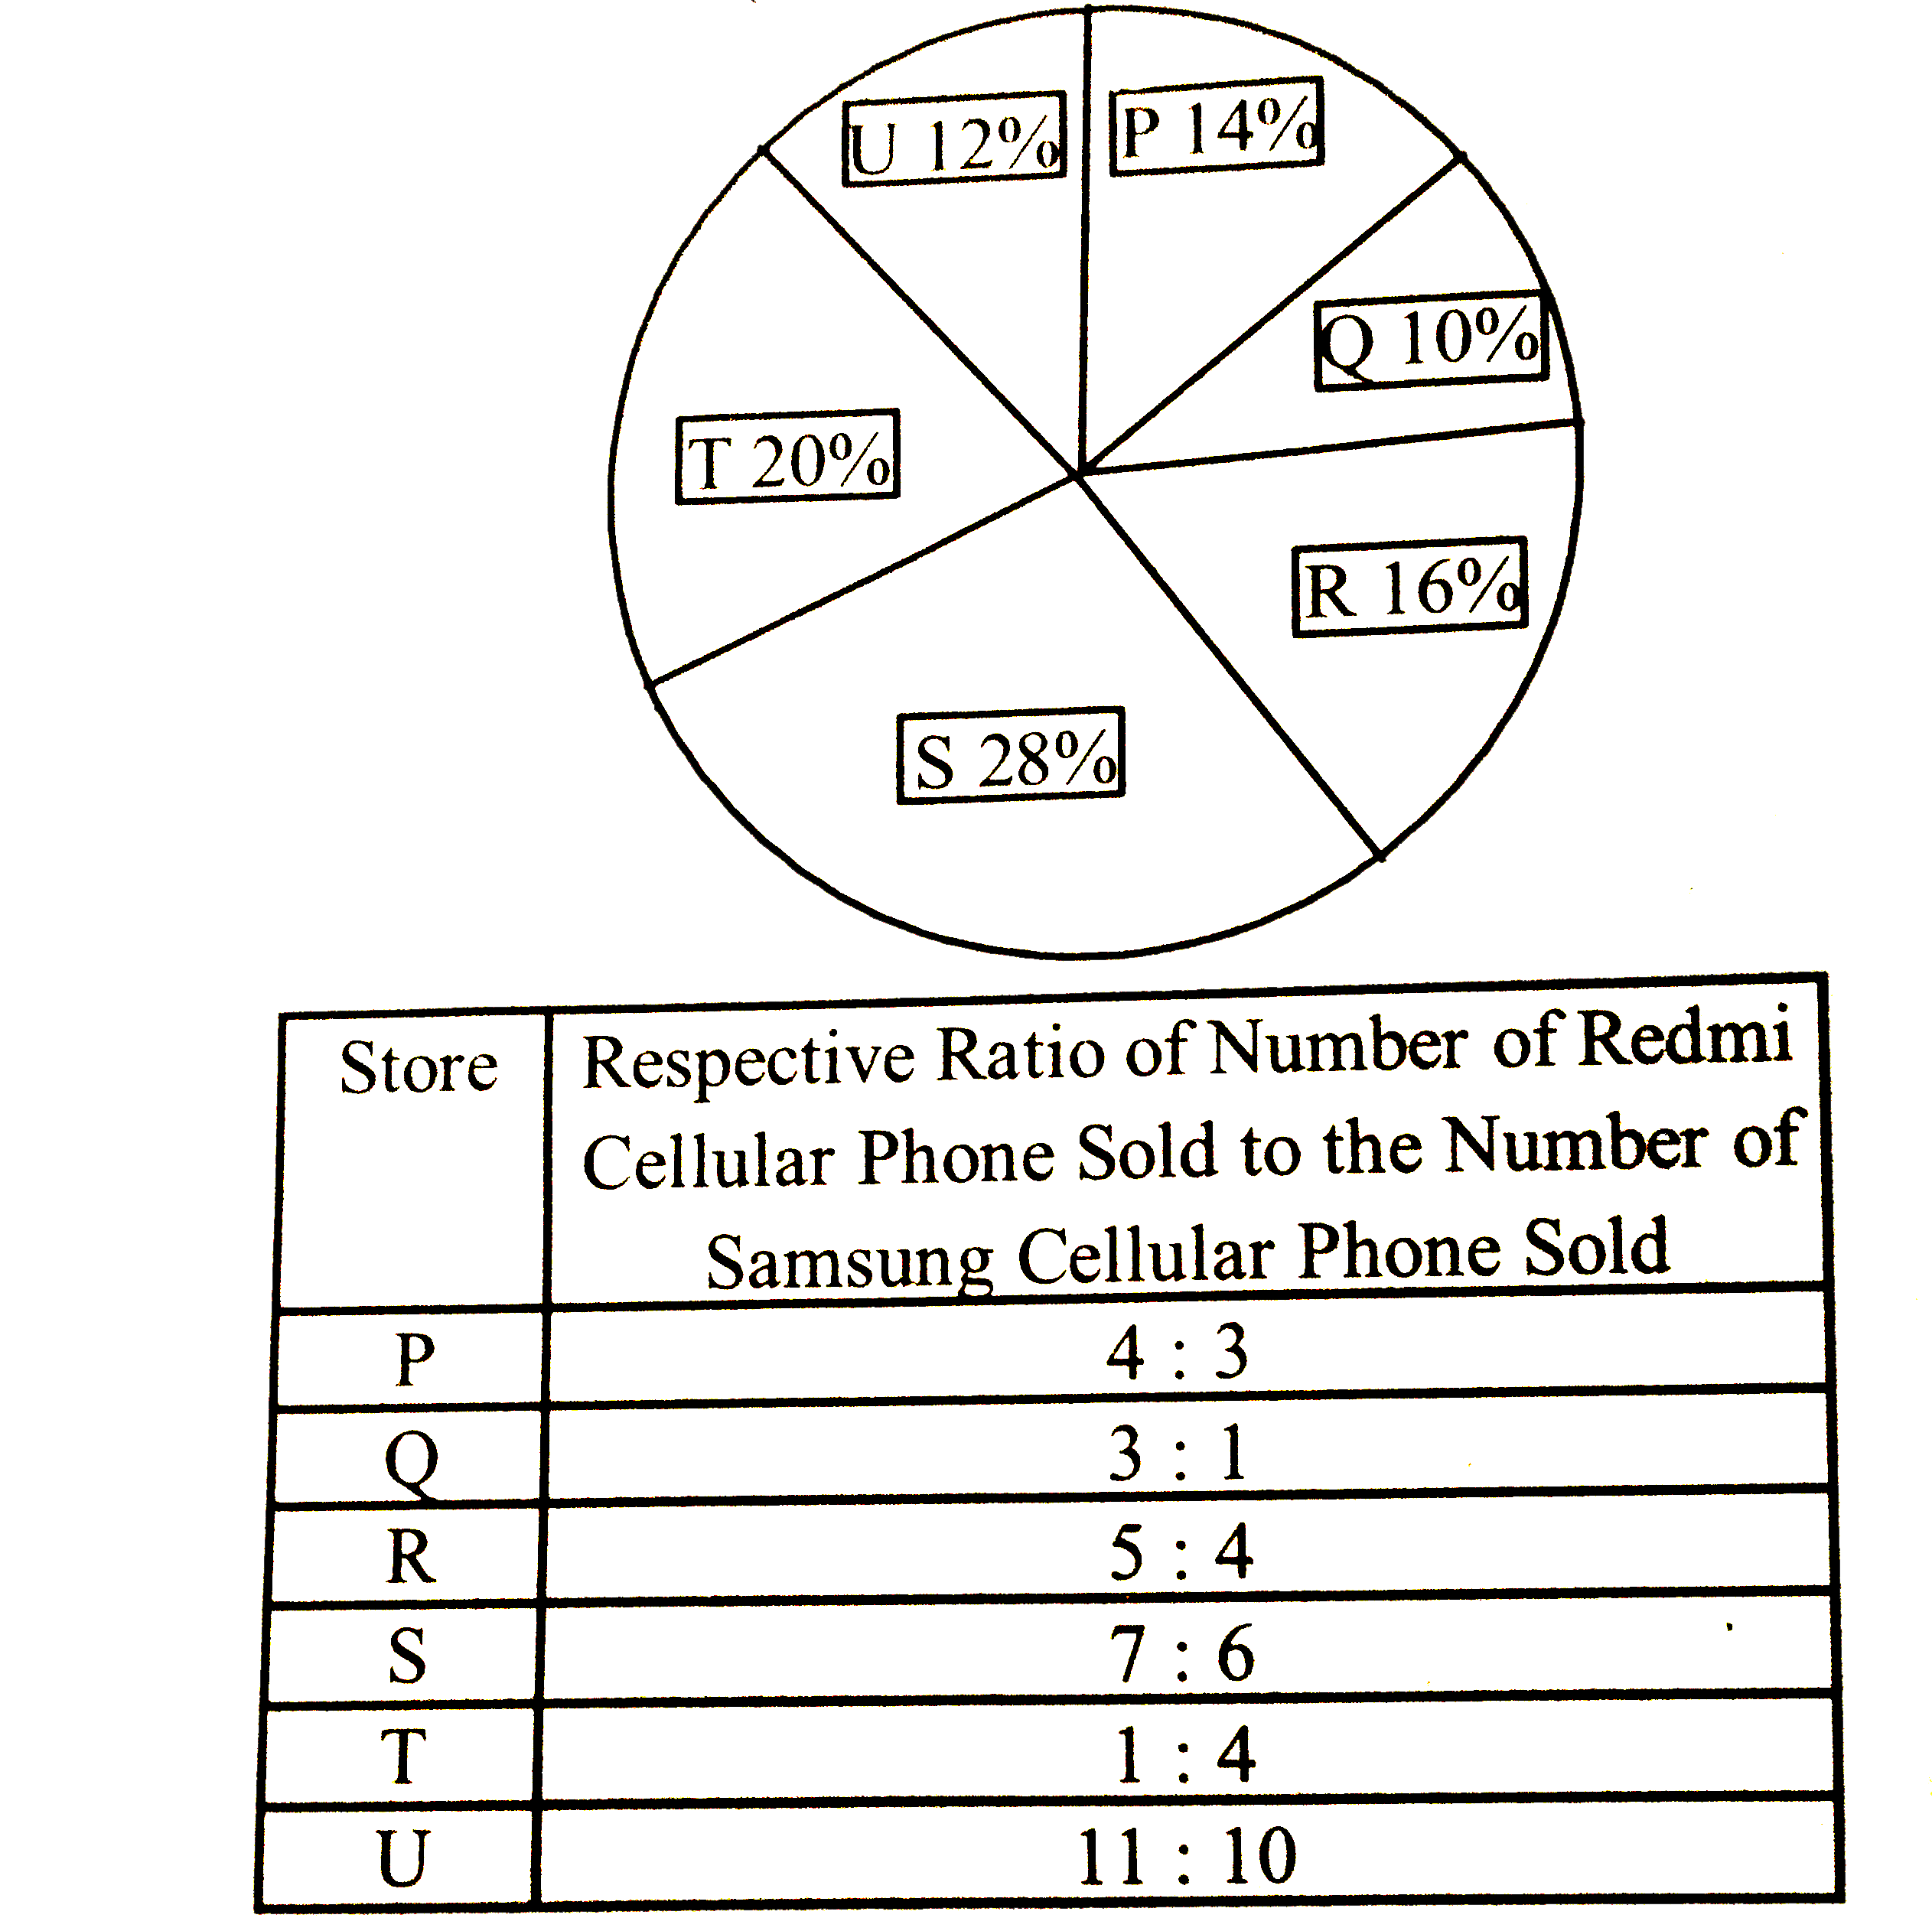
What is the respective ratio between number of Redmi cellular phones sold by stor S and total number of Samsung cellular phones sold by stores T and U together ?
View SolutionDirection: The given bar graph shows the number of pens sold by two shops A & B in four consecutive months. Study the following data and answer the following questions:
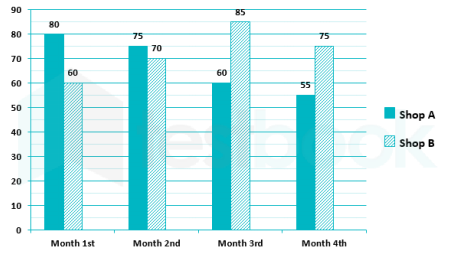
What is the difference between the number of pens sold by shop A and B together in month 3th and 4th?
View Solution
