Study the following table carefully and answer the questions based on it.
The following table shows the domestic sales of cars of five manufacturers from 2005 to 2010.
(All the figures are in thousands)
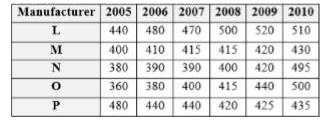
During 2006, what is the approximate share domestic sales of cars of the manufacturer M?
A. 19.5%
B. 10.5%
C. 20.5%
D. 25.5%
D
A
C
B
The correct Answer is:B
Step by step video, text & image solution for Study the following table carefully and answer the questions based on it. The following table shows the domestic sales of cars of five manufacturers from 2005 to 2010. (All the figures are in thousands) During 2006, what is the approximate share domestic sales of cars of the manufacturer M? A. 19.5% B. 10.5% C. 20.5% D. 25.5% by Maths experts to help you in doubts & scoring excellent marks in Class 14 exams.
Similar Questions
Read the following table carefully and answer the question given below-Production (in lakh tonnes)

What was the percentage decrease in production of rice from the year 2002 to 2006 ?View SolutionStudy the following table carefully and answer the questions given below:
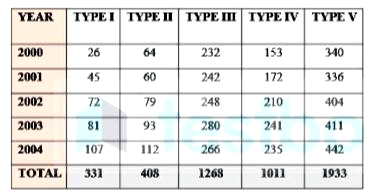
In which of the following years was the Sales of Type II vehicles approximated 25% of the Type V vehicles?View Solution
Knowledge Check
- Question 1 - Select One
Study the following table carefully and answer the questions based on it.
The following table shows the domestic sales of cars of five manufacturers from 2005 to 2010.
(All the figures are in thousands)
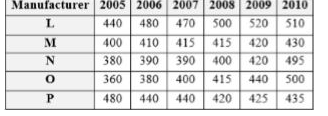
During 2010, the sales of which manufacturer has shown the maximum percentage increase over the previous year?
A. L
B.M
C.N
D.PACBDCADB - Question 2 - Select One
Study the following table carefully and answer the questions based on it.
The following table shows the domestic sales of cars of five manufacturers from 2005 to 2010.
(All the figures are in thousands)
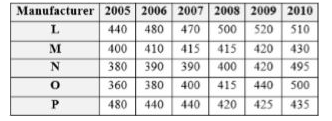
With respect to which of the following combinations, is the sales of cars the highest over the given period?
A. L. 2009
B. L, 2010
C. L, 2008
D. O, 2008ACBDCBDA - Question 3 - Select One
Study the following graph carefully and answer the questions given below
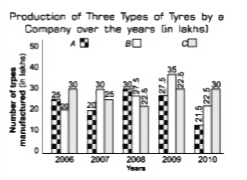
What was the percentage drop in the number of C type tyres manufactured from 2007 to 2008?A25%B10%C15%D2.5%
Study the following graph carefully and answer the question given below-----
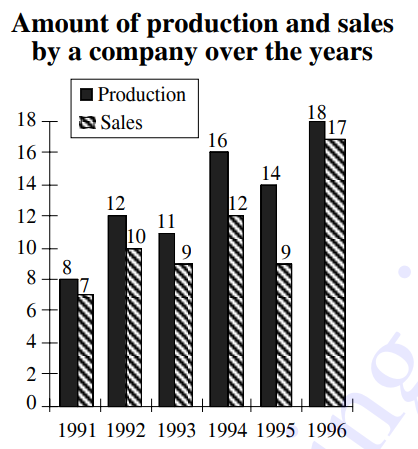
What was the percentage drop in sales from 1992 to 1993 ?View SolutionStudy the following table carefully and answer the question given below -----
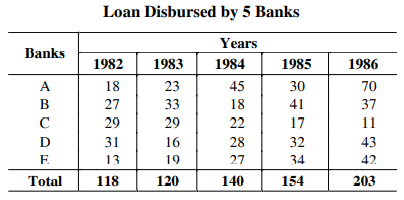
What was the percentage increase of disbursement of loans of all banks together from 1994 to 1985 ?View SolutionStudy the following table carefully and answer the questions given below it-
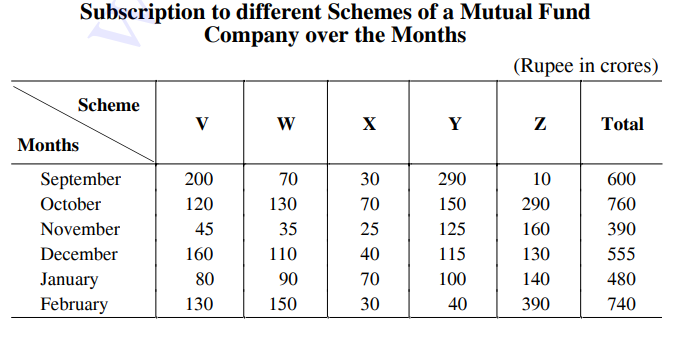
What is the percentage increase in the subscription to Z scheme from January to February ?View SolutionStudy the following table carefully to answer these questions.
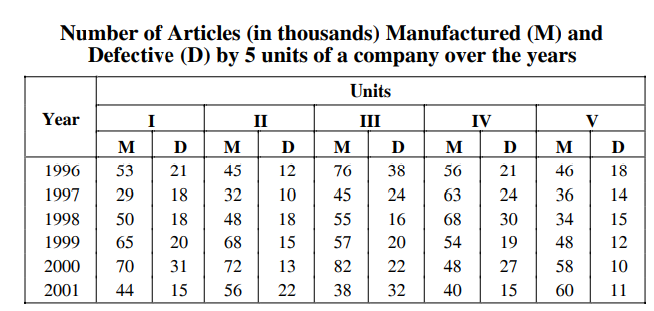
During which year was the percentage increase/decrease in manufacture from the previous year the highest for unit?View SolutionStudy the following table carefully and answer the following question The following tables gives the information of sales of sports kits by the company "XYZ" over past five years (numbers in lakhs):

For hockey what is the total sales for past 5 years ?View Solution

