Directions: Study the graph carefully and answer the question that follows.
The following bar graph shows 5 different sports played by 550 students of a College.
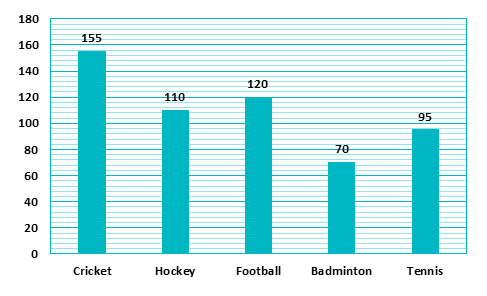
Find the difference between the total number of students who played (Cricket and Hockey) and (Football and Tennis) respectively.
70
40
60
50
The correct Answer is:D
Step by step video & text solution for Directions: Study the graph carefully and answer the question that follows. The following bar graph shows 5 different sports played by 550 students of a College. Find the difference between the total number of students who played (Cricket and Hockey) and (Football and Tennis) respectively. by Reasoning experts to help you in doubts & scoring excellent marks in Class 14 exams.
Similar Questions
Knowledge Check
- Question 1 - Select One
Study the following graph carefully and answer the questions that follow
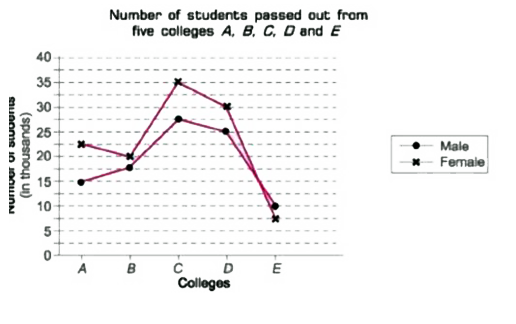
What is the difference between the total number of students passing out from collegee A and the total number o students passing out from college El.A20500BNone of theseC10500D10000 - Question 2 - Select One
Study the following graph carefully and answer the questions that follow
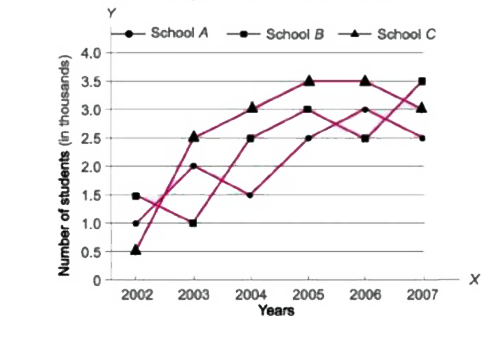
What was the difference between the total number of students in all schools together in the year 2003 and the number of students in school B in the year 2005 ?A2000B3000C3500D2500 - Question 3 - Select One
Directions (Q. Nos. 11-15) Study the radar graph carefully and answer the questions that follow.
Number of students (in thousand) in two
different universities in six different years.
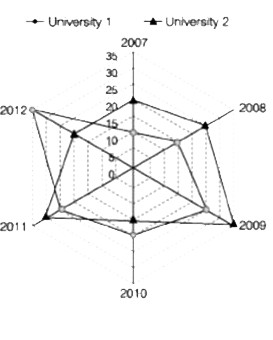
What was the difference between the number of students in University 1 in the year 2010 and the number of students in University 2 in the year 2012?A5000B15000C10000D1000
Study the bar graph and answer the following questions.
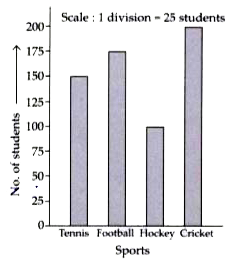
What is the difference between number of students playing football and hockey ?View SolutionThe given bar graph, shows the number of students in different classes.
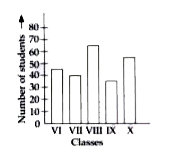
Find the total number of students in the classes VIII to X.View Solution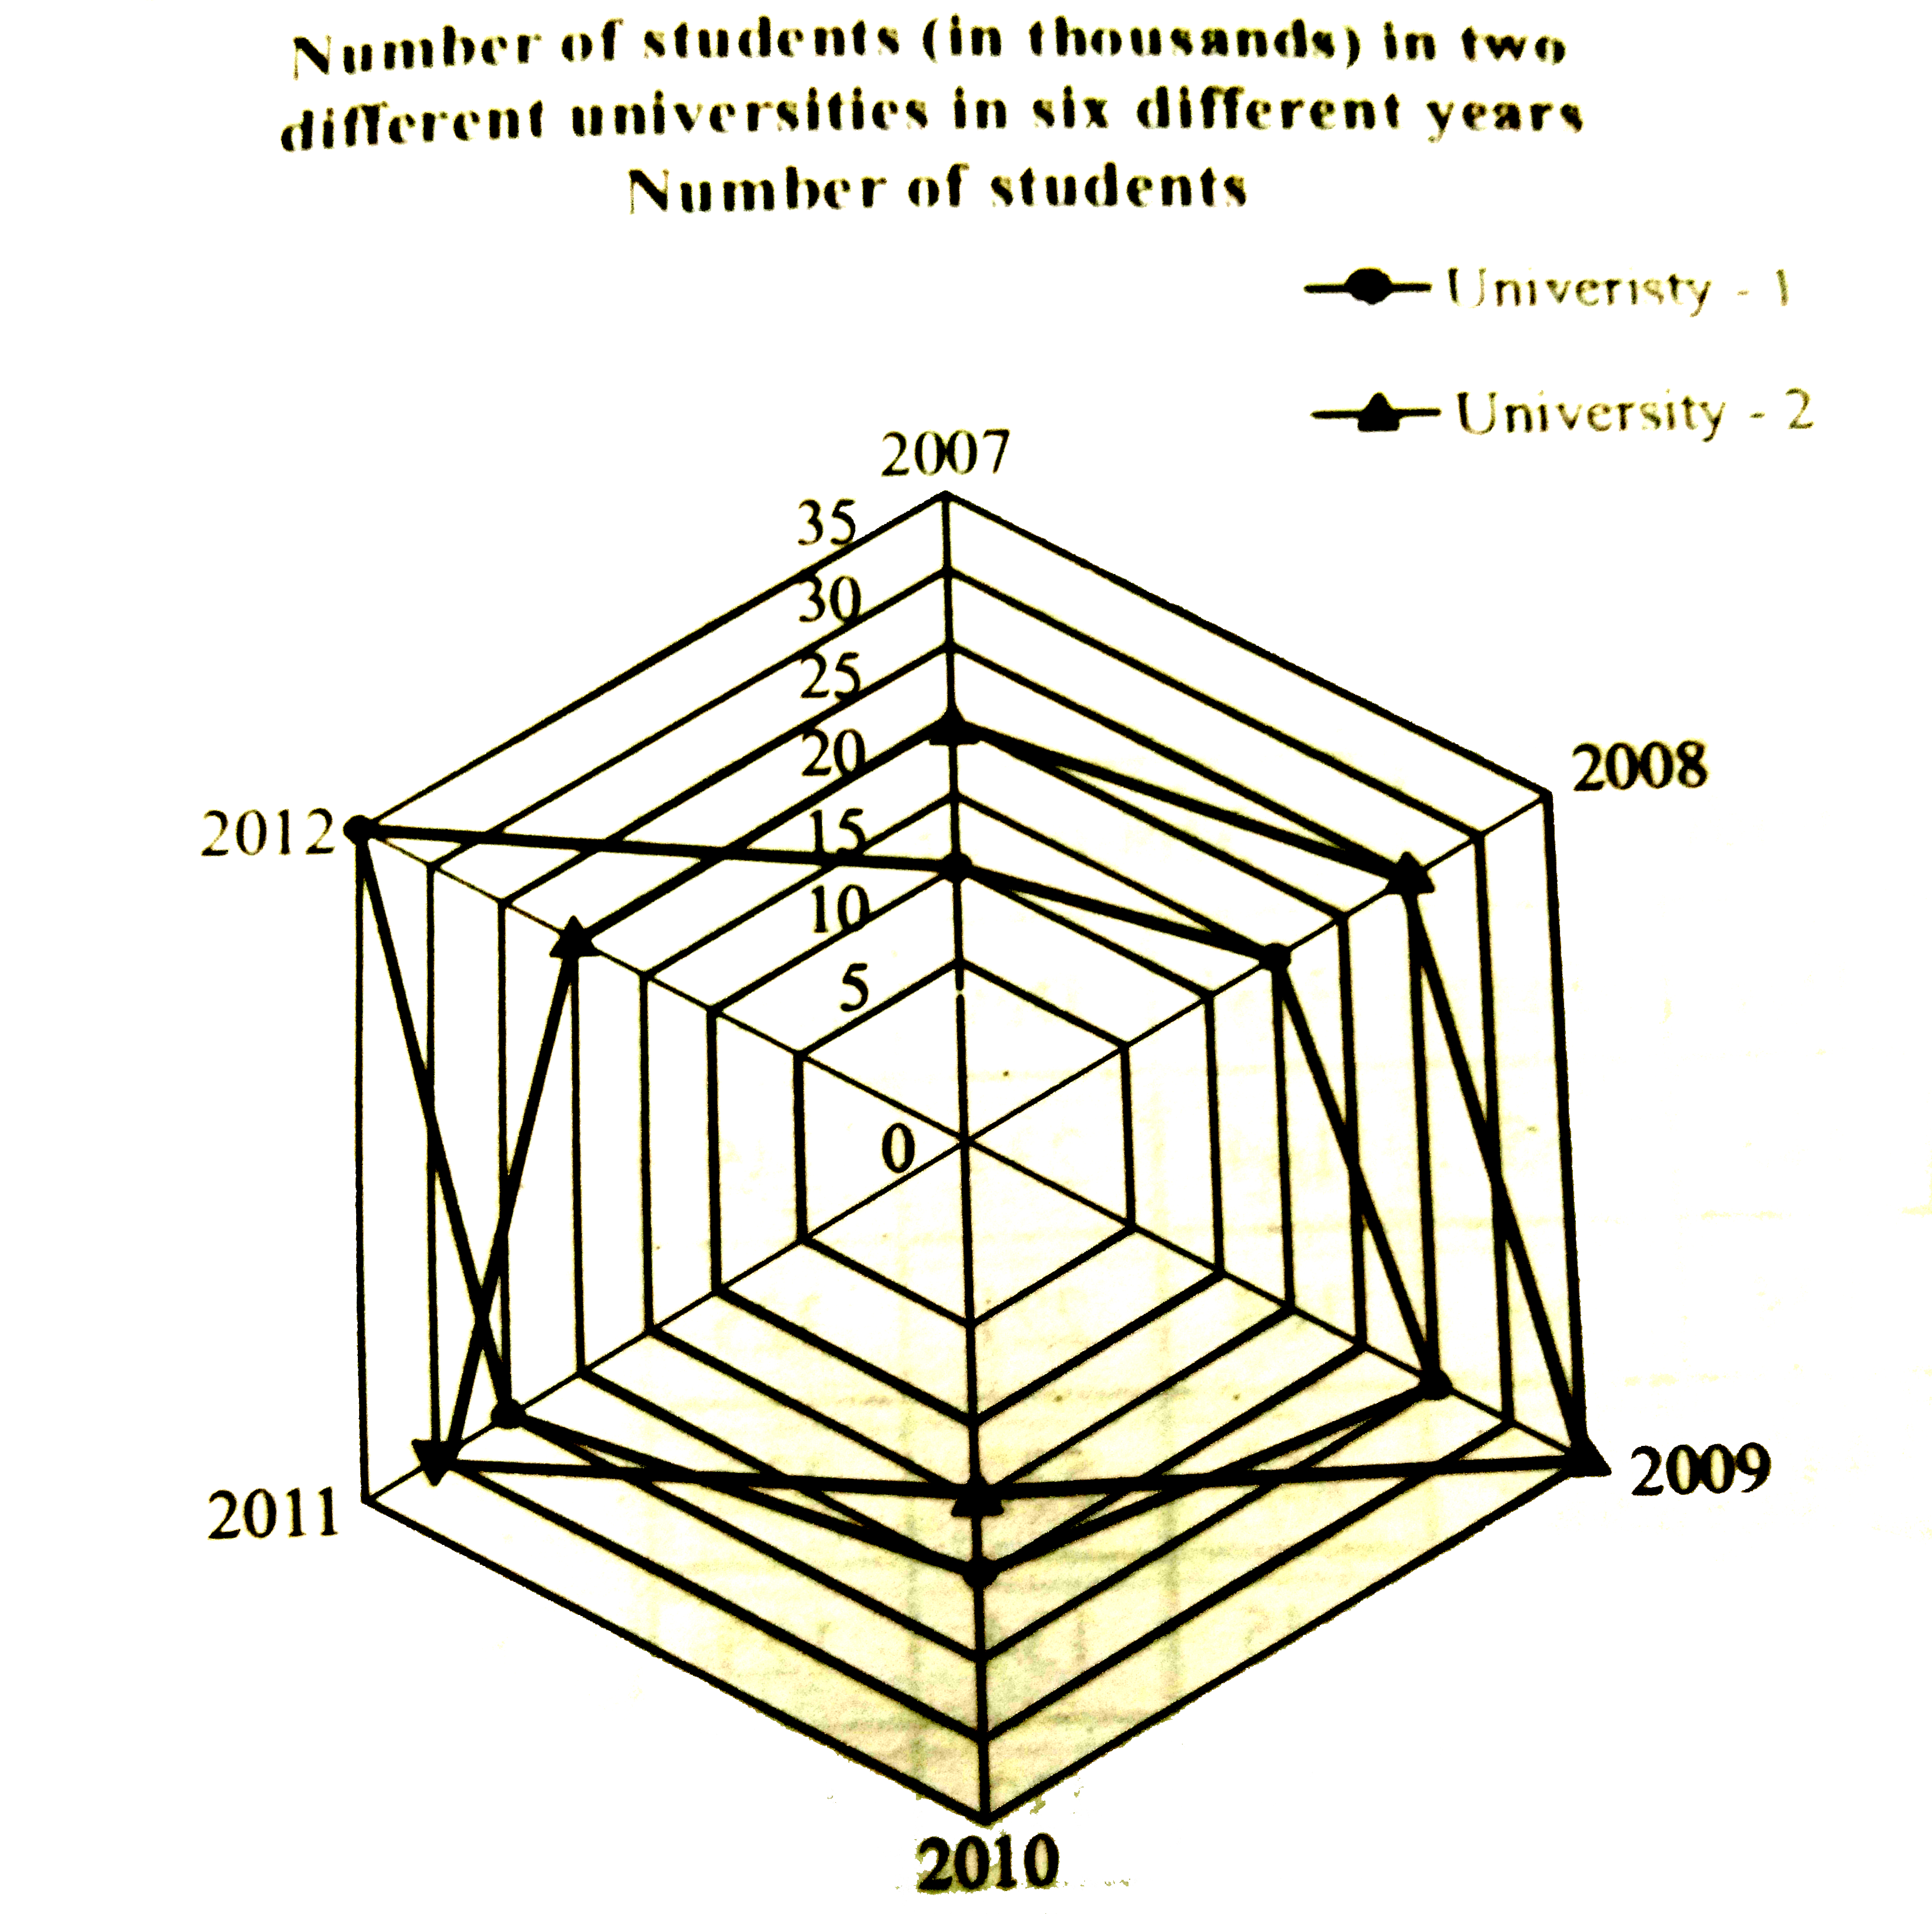
In which year was the difference between the number of students in university -I and the numer of students in university-2 highest?View SolutionStudy the following graph carefully and answer the questions that follow
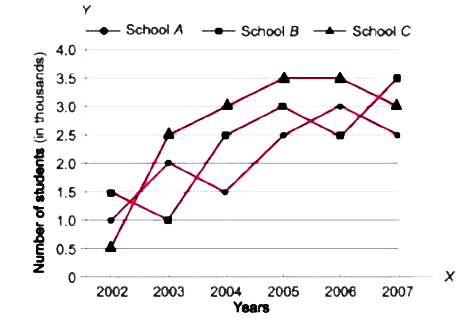
What was the average number of students in all schools together in the year 2006 ?View SolutionThe following bar graph shows the games played by the students. Study the graph carefully and answer the question given below:
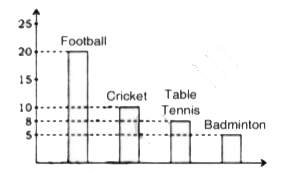
How many students play table tennis?View Solution


