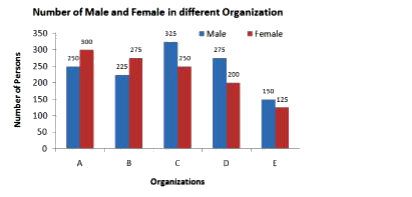
The Bar graph given below presents the number of males and females working in five different companies.
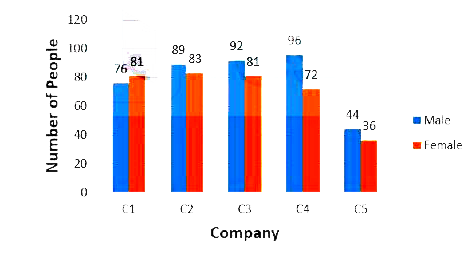
What is the average number of females working per company ?
72.2
70.6
71.8
74.6
The correct Answer is:B
Step by step video, text & image solution for The Bar graph given below presents the number of males and females working in five different companies. What is the average number of females working per company ? by Maths experts to help you in doubts & scoring excellent marks in Class 14 exams.
Similar Questions
The Bar graph shown below presents the number of employees in an office during eight consecutive years.
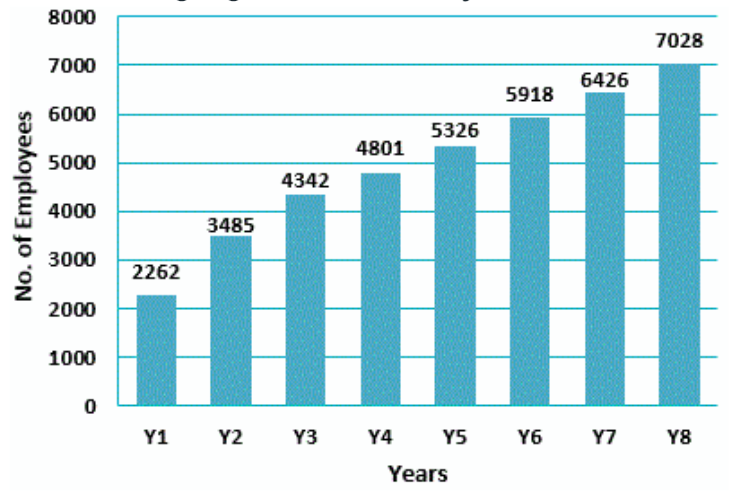
What is the average number of employess per year?View SolutionIn a company 60% workers are males. It the number of females. Workers in the company is 800. What is the number of male workers in the company ?
View Solution
Knowledge Check
- Question 1 - Select One
The Bar graph given below presents the number of males and females working in five different companies.
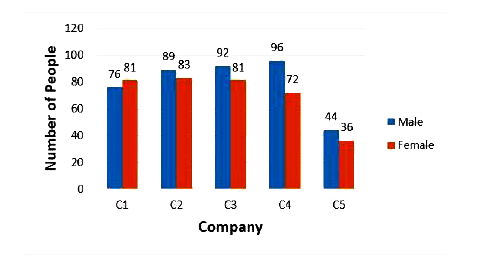
What is the ratio of the total number of males working in the Companies C2 and C3 to the total number of females working in C1 and C5 ?A171:136B181:117C182:119D183:124 - Question 2 - Select One
The Bar graph given below presents the number of males and females working in five different companies.
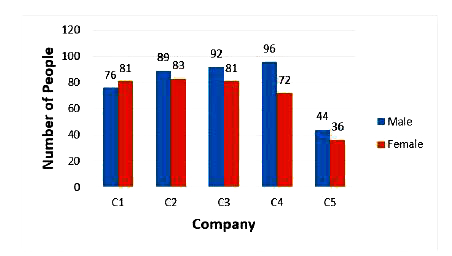
The total number of males working in these five companies is how much percent (approximately) more than the total number of females working in these five companies ?A8.52%B9.67%C14.67%D12.46% - Question 3 - Select One
The Bar graph given below presents the number of female employees working in two factories on six different days of a week.
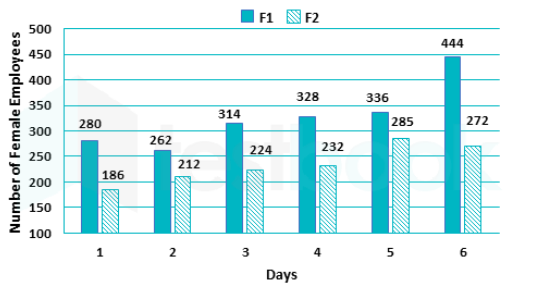
On which day the number of female workers in the factories Fl and F2, taken together, is the second highest?AA) D3BB) D6CC) D5DD) D4
Breakup of number of employes working in different departments of an organisation, the number of males and the number of employees who recently got promoted.
Total number of employees =3,600
Employees working in different departments


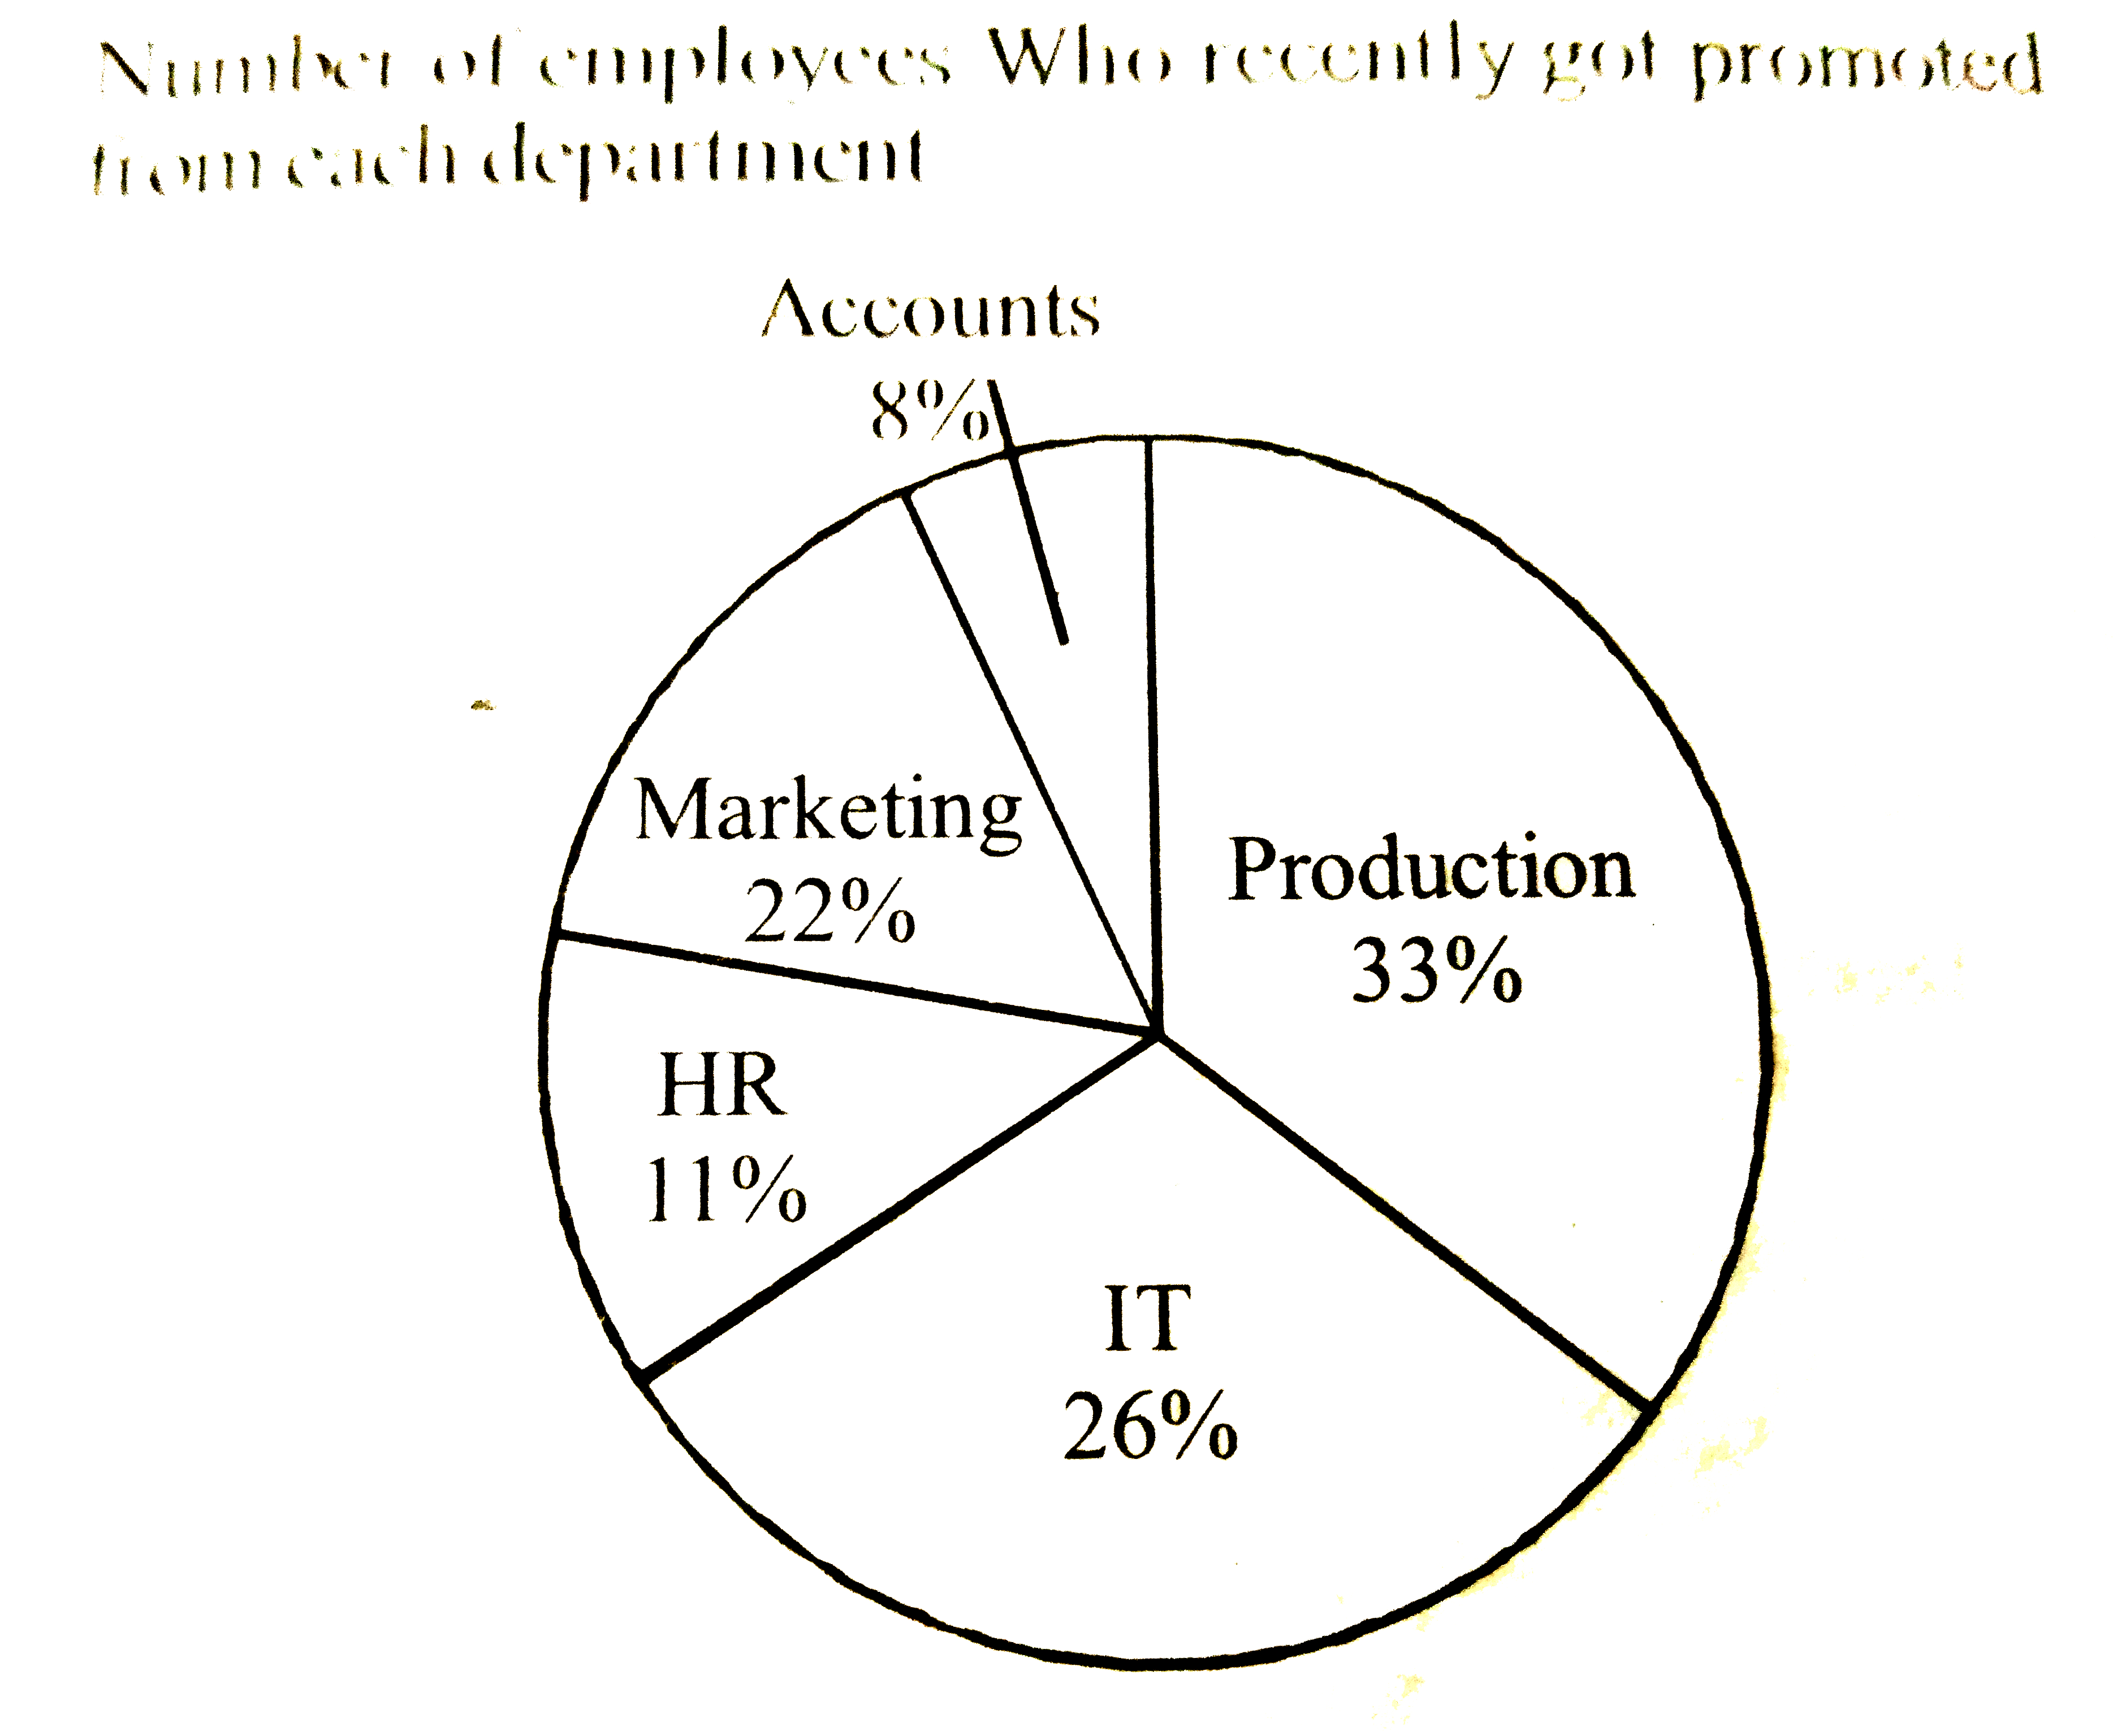
What is the total number of females working in the production and Marketing departments together ?View SolutionThe Bar graph given below presents the number of female employees working in two factories on six different days of a week.
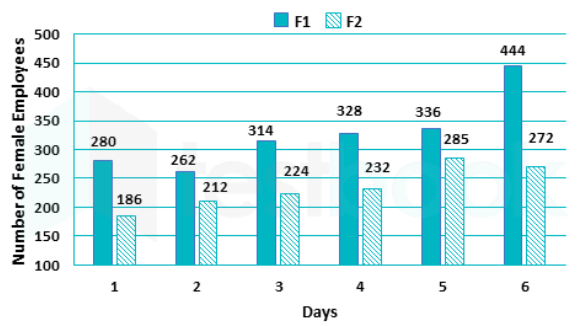
What is the difference (correct up to two decimal places) in the average number of females working per day in a factory F1 and the average number of females working per day in a factory F2?View SolutionNumber of females/ males in India
View SolutionIn the given bar graph, what is the average number of females in all five organisations?
 View Solution
The bar graph shows the total number of male and female lives in four different towns and table shows the number of males and females whose ages are above 40 years. Read the data carefully and answer the questions below:
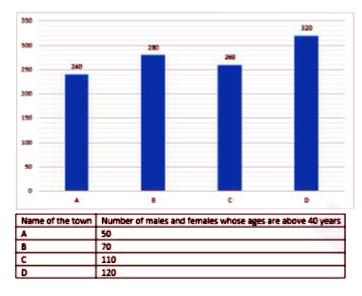
Number of males and females in town A whose ages are below and equals to 40 years is what percent less than those number of males and females in town D whose ages are below and equals to 40 years.View Solution

