The line chart given below shows the sales (in crores) of company A and B from July to December.
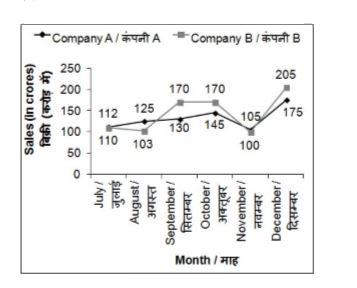
The sales of company A in November is how much percent more than the sales of company B in November?
5
10
8
15
The correct Answer is:A
Step by step video, text & image solution for The line chart given below shows the sales (in crores) of company A and B from July to December. The sales of company A in November is how much percent more than the sales of company B in November? by Maths experts to help you in doubts & scoring excellent marks in Class 14 exams.
Similar Questions
The bar chart given below shows the sales (in lacs) of 2 companies X and Y and Y from year 2011 to 2016
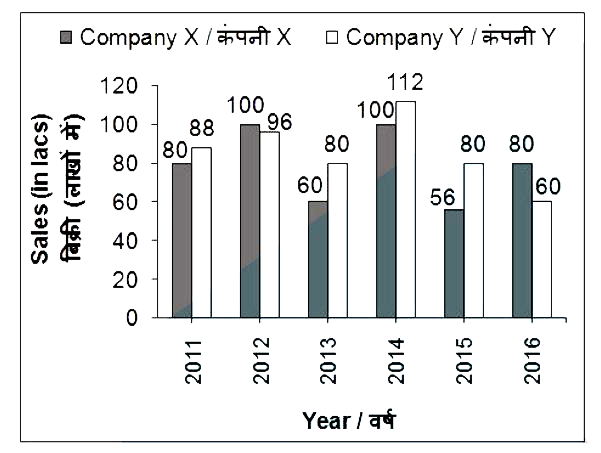
The sale of company Y in 2015 is what percent of the sale of company X in 2011?View SolutionThe bar chart given below shows the sales (in crores) of 2 companies A and B from years 2010 to 2015.
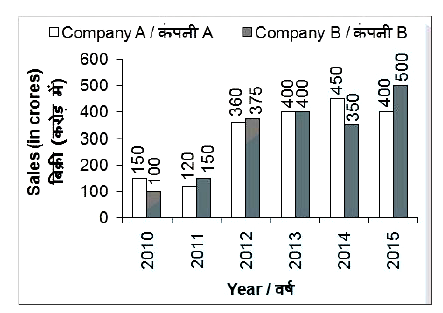
For how many years was the sale of company A greater than that of company B?View Solution
Knowledge Check
- Question 1 - Select One
The line chart given below shows the sales (in crores) of company A and B from July to December.
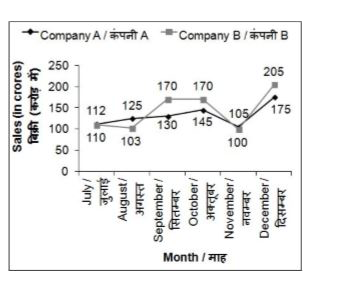
The sales of company B is same in which two months?ASeptember and OctoberBOctober and NovemberCAugust and NovemberDJuly and August - Question 2 - Select One
The line chart given below shows the sales (in crores) of company A and B from July to December.
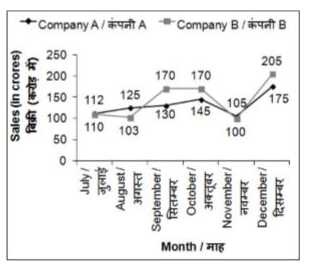
For how many months the sales of company B is more than the sales of company A?Aa)2Bb)3Cc)1Dd)4 - Question 3 - Select One
The line chart given below shows the sales (in crores) of company A and B from July to December.
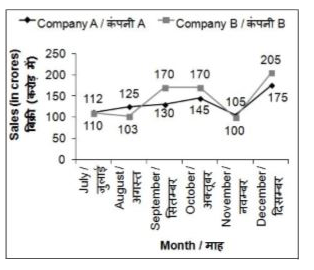
What is the average sale (in crore Rs) of company B in the given six months?A143B140C154D135
The line chart given below shows the sales (in crores) of a complany for the years 2009 to 2016
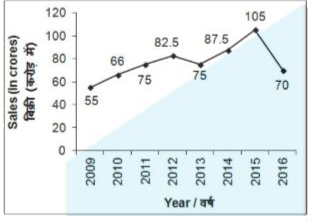
In how many years was the sale of the company more than the sale in 2011?View SolutionThe line chart given below shows the sales (in crores) of a company for the years 2009 to 2016
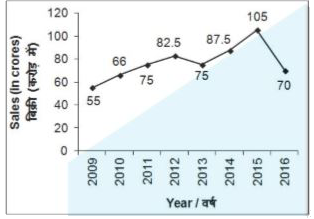
In how many years was the sale of the company a multiple of 10 crores?View SolutionThe line chart given below shows the sales (in crores) of a company for the years 2009 to 2016
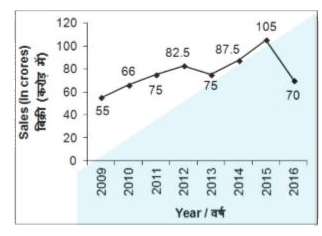
What is the average sale of the company from year 2009 to 2015?View SolutionThe bar chart given below shows the sales (in lacs) of 2 companies X and Y from year 2011 to 2016
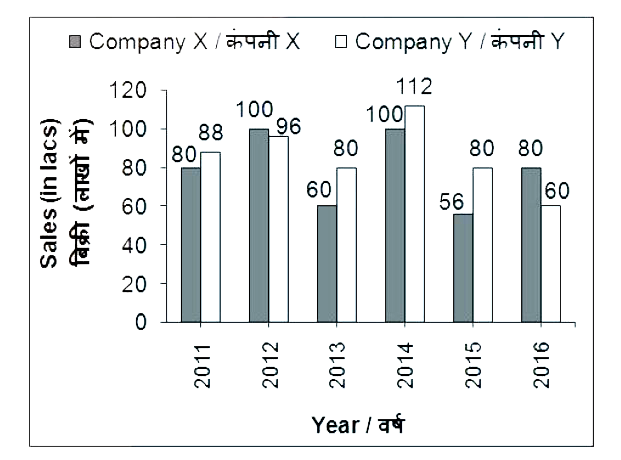
n how many years was the sale of company X more than that of company Y?View SolutionThe line chart given below shows the revenue of a company (in lac rupees) from year 2009 to 2016
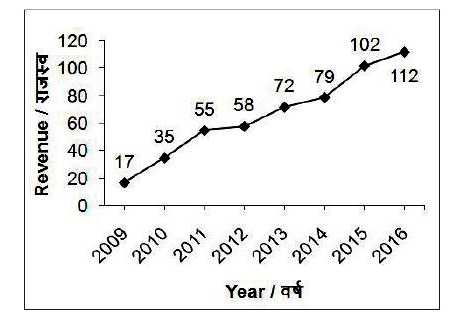
The average revenue of the company from 2013 to 2016 is how much percent more than the average revenue of the company from 2009 to 2012?View Solution

