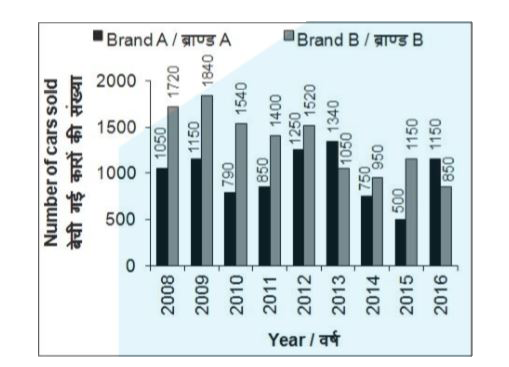
The bar chart given below shows the number of cars sold by brand A and B for the year for 2008 to 2016
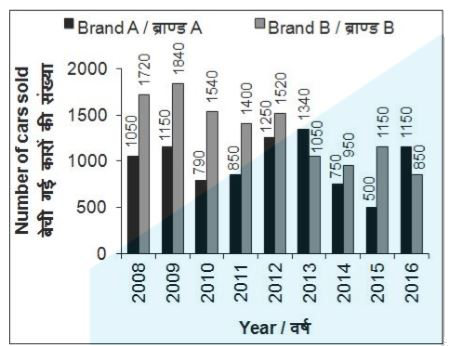
In how many years, the number of cars sold by brand A is more than the number of cars sold by brand B?
1
2
3
5
The correct Answer is:B
Step by step video, text & image solution for The bar chart given below shows the number of cars sold by brand A and B for the year for 2008 to 2016 In how many years, the number of cars sold by brand A is more than the number of cars sold by brand B? by Maths experts to help you in doubts & scoring excellent marks in Class 14 exams.
Updated on:21/07/2023Similar Questions
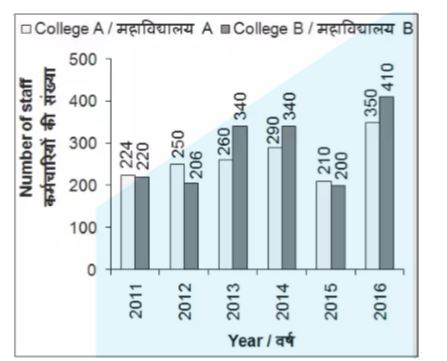
The bar chart given below shows the number of staff in college A and B from years 2011 to 2016.
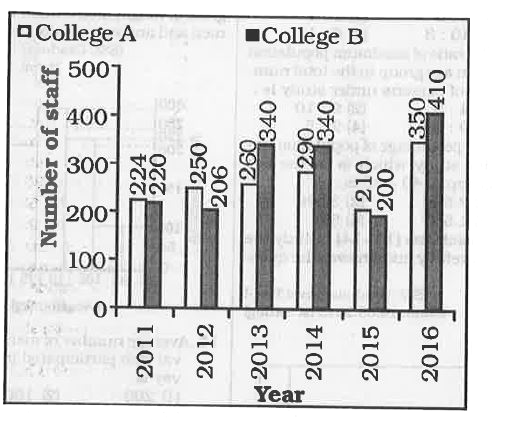
For how many years the number to staff in college B is more than the number of staff in college A?
View SolutionThe bar chart given below shows the number of cars sold by brand A and B for the year for 2008 to 2016
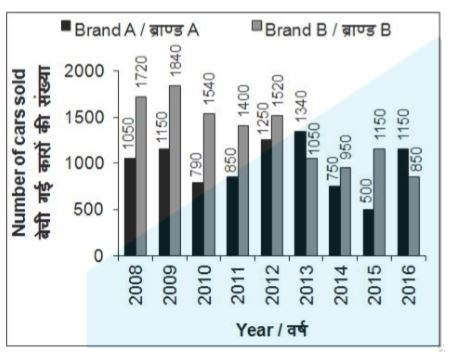
The total sales of the two brands in year 2015 is what percent of the total sales in 2016?
View Solution
Knowledge Check
The bar chart given below shows the number of cars sold by brand A and B for the year for 2008 to 2016
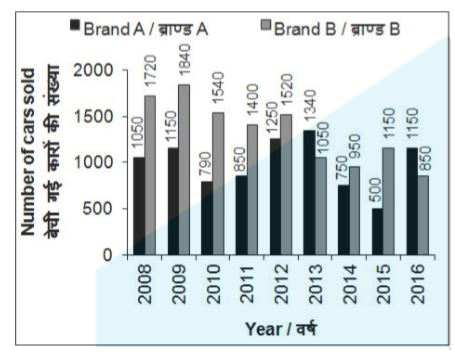
In which year from 2008 to 2016, the combined sales of brand A and B is maximum?A2008B2009C2012D2016The bar chart given below shows the number of cars sold by brand A and B for the year for 2008 to 2016
What is the percentage decrease in the number of car sold in year 2015 from year 2014 for brand A?A50B20C25D33.33The bar chart given below shows the number of staff in colleges A and B from years 2011 to 2016.
For how many years the number of staff in college B is more than the number of staff in college A?A2B3C1D4
The line chart given below shows the number of students in 2 sections X and Y from year 2009 to 2016.
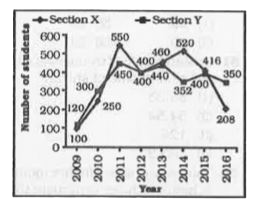
For how many years was the number of students in section Y was more than that of section X?
View SolutionThe bar chart given below shows the number of staff in colleges A and B from years 2011 to 2016.
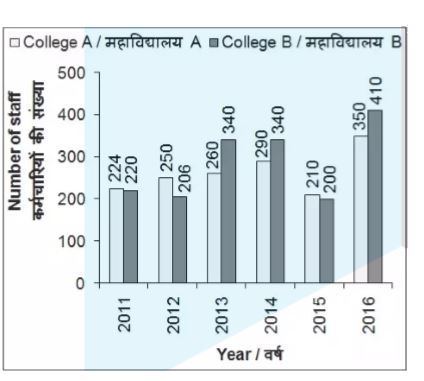
The number of staff in college A in year 2015 is how much percent more than the number of staff in college B in year 2015?
View SolutionThe table shows the number of cars sold by three showrooms over a period of six years.
यह तालिका तीन शोरूम द्वारा छः वर्षों की अवधि में बेची गयी कारों की संख्या दर्शाती है |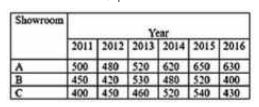 What is the average number of cars sold by showroom A over the given six years (nearest to one decimal place)?
दिए गए छः वर्षों में शोरूम A द्वारा बेची गयी कारों की औसत संख्या कितनी है ? (एक दशमलव स्थान के निकटतम )
View SolutionThe Bar graph given below presents the number of books sold by a bookseller during different months of a year.
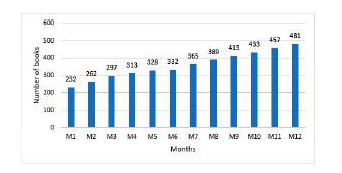
The number of books sold in month M8 is how much more than the average number of books sold per month?
View SolutionWhat was the average number of cars sold by A during Feb-Apr 2016
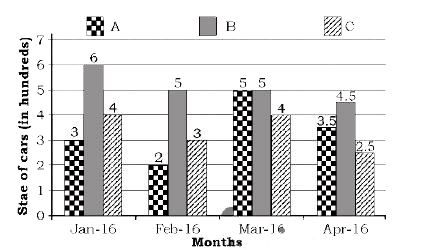
View Solution
