The bar chart given below shows the export (in lacs) from india from year 2008 to 2015.
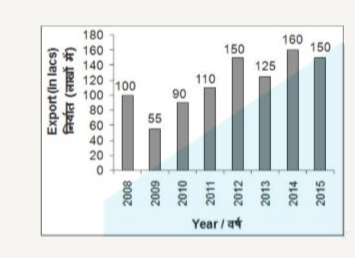
What was the difference (in lacs) between exports from India in year 2011 and year 2014?
75
25
50
100
Step by step video & image solution for The bar chart given below shows the export (in lacs) from india from year 2008 to 2015. What was the difference (in lacs) between exports from India in year 2011 and year 2014? by Maths experts to help you in doubts & scoring excellent marks in Class 14 exams.
Updated on:21/07/2023Similar Questions
The bar chart given below shows the export (in lacs) from india from year 2008 to 2015.
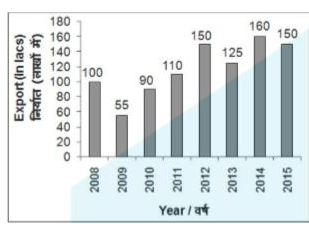
What is the percentage change in the exports from year 2012 to year 2013?
View SolutionThe bar chart given below shows the export (in lacs) from india from year 2008 to 2015.
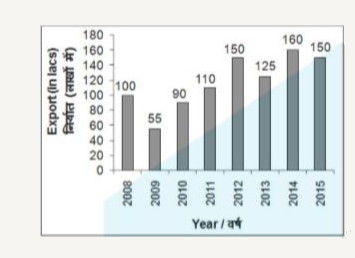
For how many years was the exports from India (in lacs) more than 110 lacs?
View Solution
Knowledge Check
The bar chart given below shows the sales (in crores) of 2 companies A and B from years 2010 to 2015.
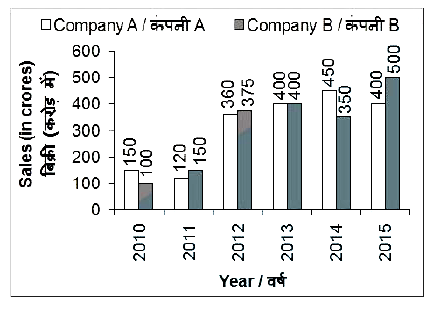
What is the difference (in crores) between the sales of company A in 2012 and company B in 2015?A15B140C40D150The bar chart given below shows the sales (in lacs) of 2 companies X and Y from year 2011 to 2016
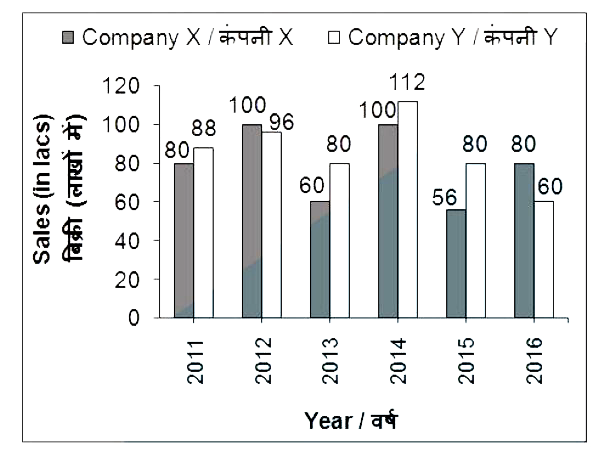
What was the average sale (in lacs) of company Y from 2012 to 2016?A104B85.6C140D170.4The bar chart given below shows thes sales (in lacs) of 2 companies X and Y from year 2011 to 2016
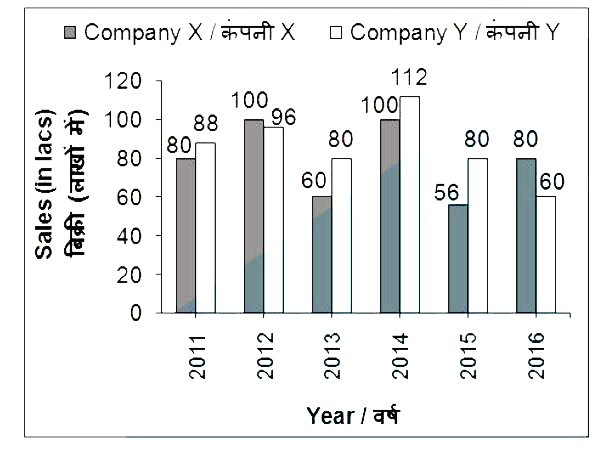
What was the percentage change in the sale of company X from year 2011 to 2015?A30B80C50D60
The bar chart given below shows the export (in lacs) from india from year 2008 to 2015.
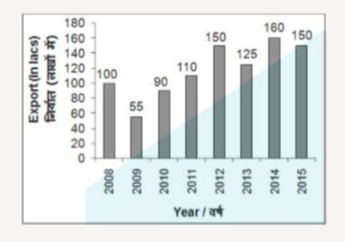
In year 2015, the export was more than that of which of the following year?
View SolutionThe bar chart given below shows the sales ( in crores) of company P from years 2009 to 2015.
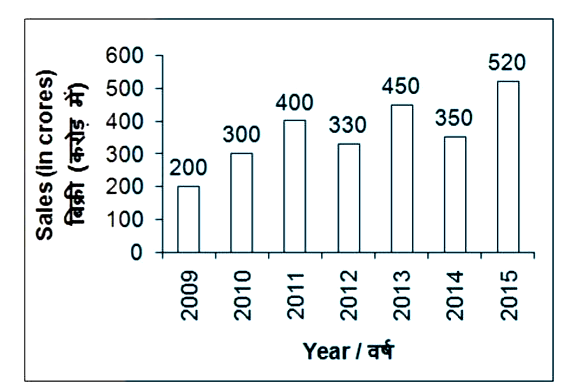
What is the percentage change in sales from year 2010 to 2014?
View SolutionThe bar chart given below shows the revenue (in crores) of company A for the years 2008 to 2015.
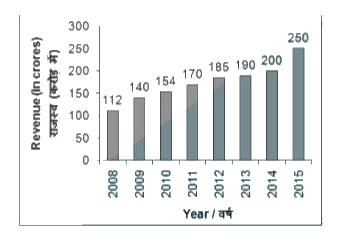
What is the average revenue (in crore Rs) per year from 2011 to 2015?
View SolutionThe bar chart given below shows the sales (in crores) of 2 companies A and B from years 2010 to 2015.
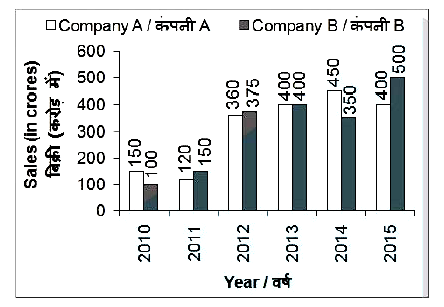
What is the percentage change in sale of company B from years 2011 to 2012?
View SolutionThe bar chart given below shows the sales (in crores) of 2 companies A and B from years 2010 to 2015.
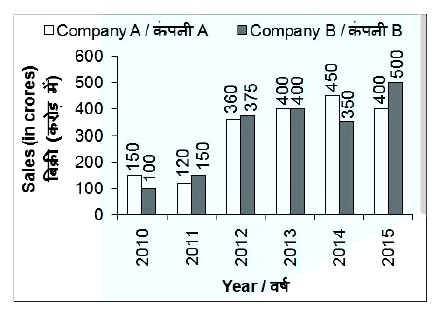
What is the average sale (in crores) of company A from years 2010 to 2015?
View Solution
