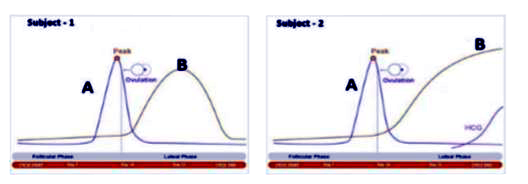
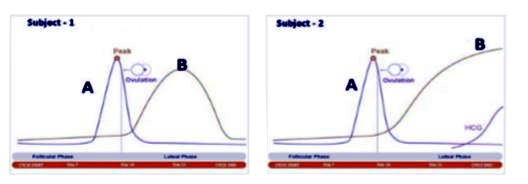
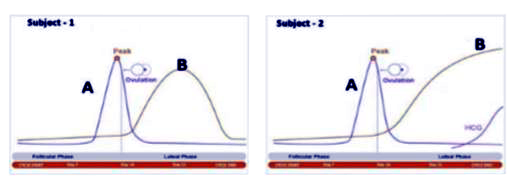
To answer the questions, study the graphs below for Subject 1 and 2 showing differentlevels of certain hormones.
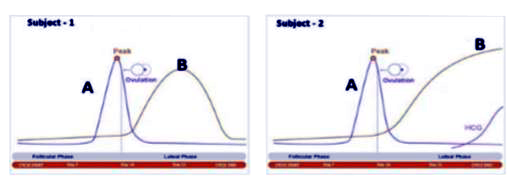
Which structure in the ovary will remain functional in subject 2?
Corpus Luteum
Tertiary follicle
Graafian follicle
Primary follicle
Step by step video & image solution for To answer the questions, study the graphs below for Subject 1 and 2 showing differentlevels of certain hormones. Which structure in the ovary will remain functional in subject 2? by Biology experts to help you in doubts & scoring excellent marks in Class 12 exams.
Updated on:21/07/2023Topper's Solved these Questions
- SAMPLE PAPER 2022BOOK - CBSE MODEL PAPERCHAPTER - SAMPLE PAPER 2022EXERCISE - Questions in lieu of diagram based questions for VI candidates (Section - A)
5 Videos
- SAMPLE PAPER 2022BOOK - CBSE MODEL PAPERCHAPTER - SAMPLE PAPER 2022EXERCISE - Questions in lieu of diagram based questions for VI candidates (Section - B)
4 Videos
- SAMPLE PAPER 2022BOOK - CBSE MODEL PAPERCHAPTER - SAMPLE PAPER 2022EXERCISE - SECTION - B
24 Videos
- PRACTICE PAPER 2022BOOK - CBSE MODEL PAPERCHAPTER - PRACTICE PAPER 2022EXERCISE - MULTIPLE CHOICE QUESTION
60 Videos
- SAMPLE PAPER 2022 TERM IIBOOK - CBSE MODEL PAPERCHAPTER - SAMPLE PAPER 2022 TERM IIEXERCISE - SECTION C
2 Videos
Similar Questions
To answer the questions, study the graphs below for Subject 1 and 2 showing differentlevels of certain hormones.
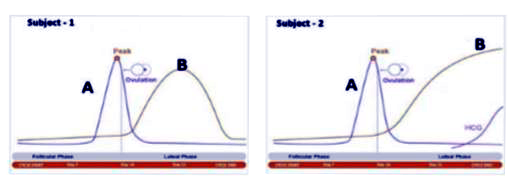
The peak observed in Subject 1 and 2 is due to
View SolutionTo answer the questions, study the graphs below for Subject 1 and 2 showing differentlevels of certain hormones.
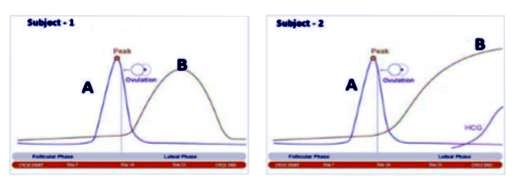
Subject 2 has higher level of hormone B, which is
View Solution
Knowledge Check
Study the graph carefully and answer the questions.
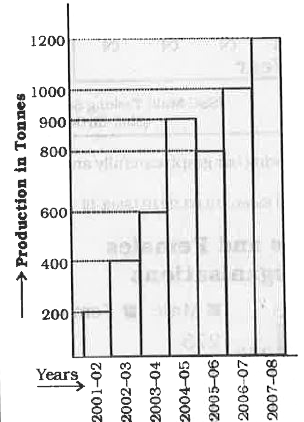
The graph shows production of an item (in tonnes) during certain years
The year in which productions increased the lowest as compared to the previous year isA2007 - 08B2003 - 04C2004 - 05D2006 - 07Study the following information carefully and answer the questions given below it.
Percentage marks obtained by 6 students in various subjects

What is the approximate average marks obtained by student T in all the subject together ?A86B76C80D72
To answer the questions, study the graphs below for Subject 1 and 2 showing differentlevels of certain hormones.
Which of the following statements is true about the subjects?
View SolutionTo answer the questions, study the graphs below for Subject 1 and 2 showing differentlevels of certain hormones.
If the peak of Hormone A does not appear in the study for Subject 1, which of thefollowing statement is true?
View SolutionTo answer the questions, study the graphs below for Subject 1 and 2 showing differentlevels of certain hormones.
For subject 2 it is observed that the peak for hormone B has reached the plateau stage.After approximately how much time will the curve for hormone B descend?
View SolutionA biology student after studying about the different levels of hormones during the menstrual cycle was comparing 2 subjects (Patients). A table was created after looking at the levels of hormones A and B for Subject 1 and 2. Read the information in the table and answer the questions that follow

Which structure in the ovary will remain functional in subject 2?
View SolutionLook at the bar graph given below.
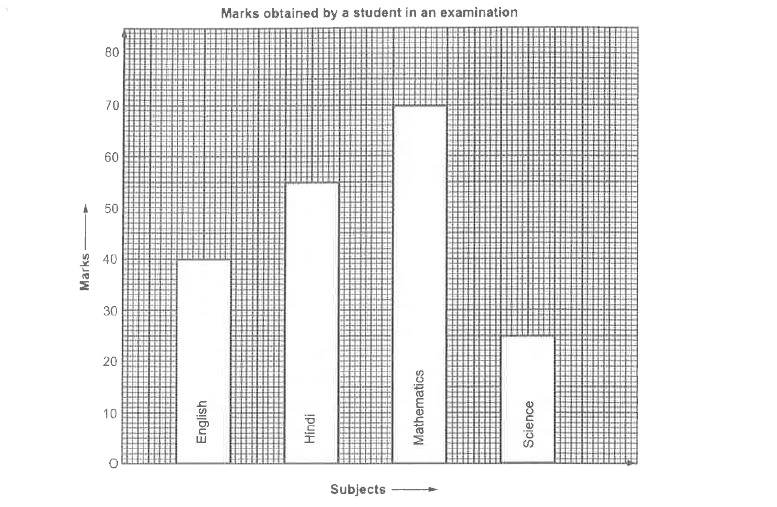
Read if cerefully and answer the questions given below:
What information does the bar graph give ?
In which subject is the student poorest ?
In which subject is the student best ?
In which subjects did he get more than 40 marks ?
View SolutionDirection: The pie chart shows the results of an online survey which asked students about their favorite subject. Study the graph carefully and answer the following questions.
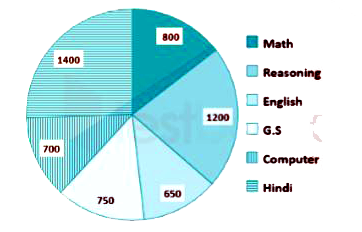
What is the ratio of students who say their favourite subject is G.S and English taken together to the students who say their favorite subject is Computer and Reasoning taken together?
View Solution
