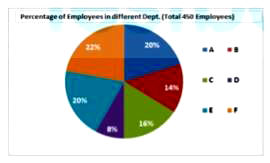
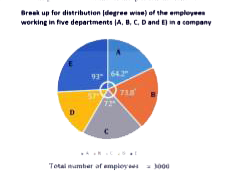
The given pie chart shows the percentage distribution of 450 employees in an organisation. Study the pie chart and answer the question that follows
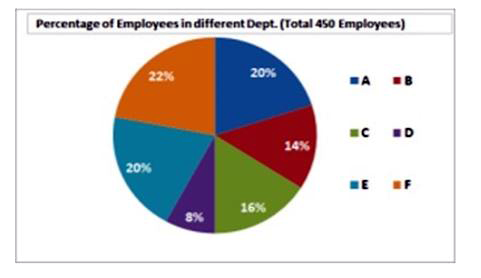
If 60% of the employees in department E are females, how many male employee are there in that department ?
18
54
72
36
The correct Answer is:D
Step by step video, text & image solution for The given pie chart shows the percentage distribution of 450 employees in an organisation. Study the pie chart and answer the question that follows If 60% of the employees in department E are females, how many male employee are there in that department ? by Maths experts to help you in doubts & scoring excellent marks in Class 14 exams.
Similar Questions
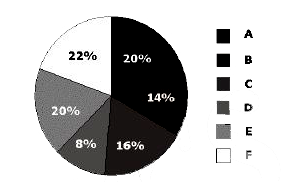
In the given pie chart if the total employees are 450 and female employees in department D is 75%, then how many male employees are in that department
 View Solution
The given pie chart shows the percentage distribution of 450 employees in an organization. Study the pie chart and answer the questions that follow
दिए गए पाई चार्ट एक संगठन में 450 कर्मचारियों के प्रतिशत को दर्शाता है। पाई चार्ट का अध्ययन करें और आने वाले प्रश्नों का उत्तर दें।
If 75% of the employees in department D are males, how many female employees are there in that department ?
यदि विभाग D में 75% कर्मचारी पुरुष हैं, तो उस विभाग में कितनी महिला कर्मचारी हैंView Solution
Knowledge Check
- Question 1 - Select One
The given pie chart shows the percentage distribution of 450 employees in an organisation. Study the pie chart and answer the question that follows.
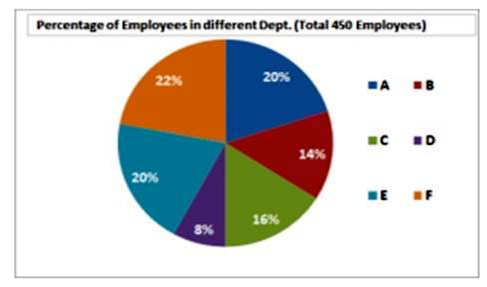
What is the number of employees working in departmetn B?A90B72C36D63 - Question 2 - Select One
The given pie chart shows the percentage distribution of 450 employees in an organisation. Read the pie chart and answer the question that follows.
Percentage of Employees in different Departments (Total 450 Employees )
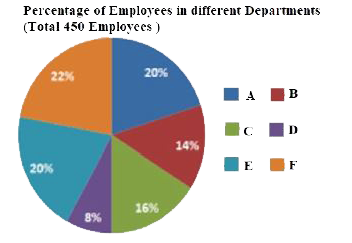
If 75% of the employees in department D are males, how many female employees are there in that department?Aa)9Bb)36Cc)27Dd)18 - Question 3 - Select One
The given pie chart shows the percentage distribution of 450 employees in an organisation. Study the pie chart and answer the question that follows
What is the central angle of the sector representing the number of employees in department A ?A72∘B108∘C90∘D36∘
The given pie chart shows the percentage distribution of 450 employees in an organization. Study the pie chart and answer the questions that follow
दिए गए पाई चार्ट एक संगठन में 450 कर्मचारियों के प्रतिशत को दर्शाता है। पाई चार्ट का अध्ययन करें और आने वाले प्रश्नों का उत्तर दें।
What is the central angle of the sector representing the number of employees in department A?
विभाग A में कर्मचारियों की संख्या का प्रतिनिधित्व करने वाले क्षेत्र का केंद्रीय कोण क्या है?View SolutionThe given pie chart shows the percentage distribution of 450 employees in an organisation. Read the pie chart and answer the question that follows.
Percentage of Employees in different Departments (Total 450 Employees )
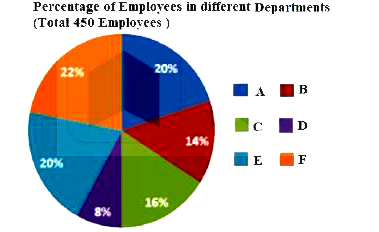
What is the number of employees working in department F?View SolutionThe given pie chart shows the percentage distribution of 450 employees in an organisation. Read the pie chart and answer the question that follows.
Percentage of Employees in different Departments (Total 450 Employees )
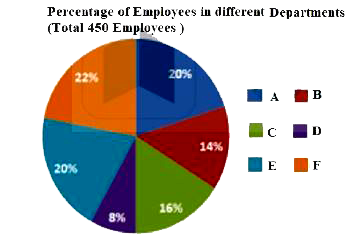
What is the central angle of the sector representing the number of employees in department E?View Solution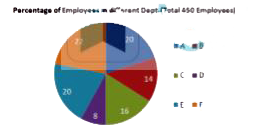
In the given pie-chart, if the female employees in department D is 75%. then how many male employees are in that department?View SolutionStudy the given graph and answer the questopm the follows
The number of employees in department B is what per cent of the total number of employees woking departments D and E ?View Solution

