The given pie chart represents the popularity of ice-cream flavours in the year 2015.
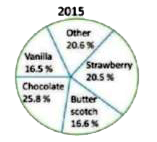
In 2015, if the total sale of chocolate flavour is for ~ 5 , 1 60 , then the total sale (in Rs) for vanilla flavour is:
3300
4120
4100
5160
The correct Answer is:A
Step by step video & image solution for The given pie chart represents the popularity of ice-cream flavours in the year 2015. In 2015, if the total sale of chocolate flavour is for ~ 5 , 1 60 , then the total sale (in Rs) for vanilla flavour is: by Maths experts to help you in doubts & scoring excellent marks in Class 14 exams.
Updated on:21/07/2023Similar Questions
The given pie charts represent the popularity of ice-cream flavours in the years 2005 and 2015.
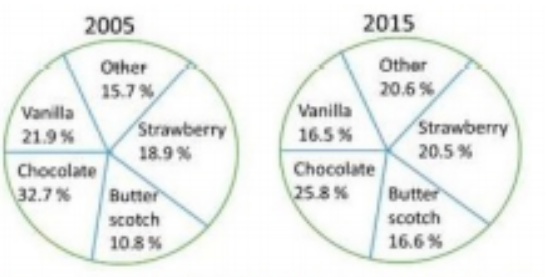
If a percentage point shift results in annual additional sales of Rs 5,000, how much (in Rs), did the combined annual strawberry and butterscotch sales increa se from 2005 ro 2015?
View SolutionThe given pie chart represents the popularity of ice-cream flavours in the years 2005 and 2015
दिए गए पाई चार्ट वर्ष 2005 और 2015 में आइसक्रीम के स्वादों की लोकप्रियता को दर्शाता हैं
If a percentage point shift results in annual addition sales of Rs. 5,000. How much (in Rs.), did the combined annual strawberry and butterscotch sales from 2005 to 2015?
यदि प्रतिशत बिंदु चक्र 10,000 रु की वार्षिक अतिरिक्त बिक्री में बदलता है| तो 2005 और 2015 में स्ट्रॉबेरी और बटरस्कॉच की संयुक्त वार्षिक बिक्री में कितनी वृद्धि की होगी |
View Solution
Knowledge Check
The given pie chart represents the popularity of ice-cream flavours in the year 2015.
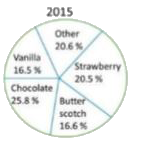
In 2015, if the total sale of vanilla flavour is for ₹ 3,300 , then total sale (in ₹) for chocolate flavour is :A₹ 5,160B₹ 4,100C₹ 4,120D₹ 3,320The given pie char represents the popularity of ice-cream flavours in the year 2005.
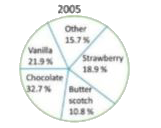
In 2005, if 10 % of the 'other' category is mix fruit flavour and 1570 people surveyed preferred mix fruit flavour, then how many people were surveyed ?A400000B150000C100000D175000The given pie charts represent the popularity of ice-cream flavours in the years 2005 and 2015.
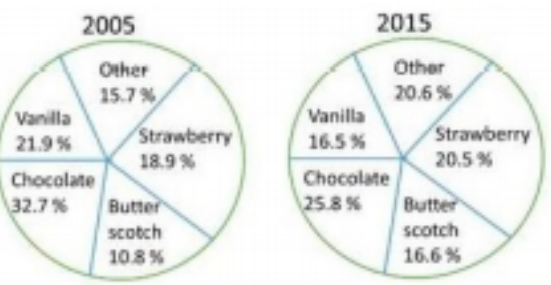
If a percentage point shift results in annual additional sales ₹ 10,000 how much (in ₹), did the combined annual strawberry and butterscotch sales increase from 2005 to 2015 ?A₹ 65,000B₹ 10,000C₹ 74,000D₹ 37,000
The given pie chart represents the popularity of ice-cream flavours in the year 2005 and 2015
2015 दिए गए पाई चार्ट वर्ष 2015 में आइसक्रीम के स्वादों की लोकप्रियता को दर्शाता हैं
In 2005, if 40% of the ‘other’ category is mix fruit flavour and 1570 people surveyed preferred mix fruit flavour, then how many people were surveyed?
2005 में, यदि अन्य श्रेणी का 40% मिक्स फ्रूट स्वाद है और 1570 लोगों ने पसंदीदा मिक्स फ्रूट स्वाद है सर्वेक्षण में पता लगा है, तो कितने लोगों का सर्वेक्षण में हिस्सा लिया था |
View SolutionThe given pie chart represents the popularity of ice-cream flavours in the year 2005 and 2015.
दिया गया पाई चार्ट वर्ष 2005 और 2015 में आइसक्रीम के स्वादों की लोकप्रियता को दर्शाता है ।
If a percentage point shift results in annual additional sales of Rs. 10,000. How much(in Rs.), did the combined annual strawberry and butterscotch sales increase from 2005 to 2015?
यदि प्रतिशत बिंदु में खिसकाव 10,000 रुपये की वार्षिक अतिरिक्त बिक्री का परिणाम देता है, तो 2005 से 2015 में स्ट्रॉबेरी और बटरस्कॉच की संयुक्त वार्षिक बिक्री में कितनी वृद्धि हुई है?
View SolutionThe given bar chart shows the sales of books in four metro branches ofa company for the years 2014 and 2015
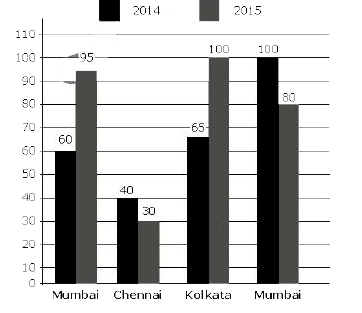
In the given bar chart the ratio the total sales between Mumbai and Delhi is
View SolutionThe line chart given blow represents the sales (in 00) of trousers ans shirts for five months.
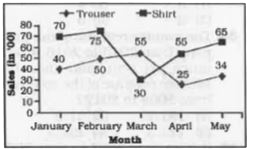
Total sale of shirts for five months is how much per cent more than the total sale of trousers for five months?
View SolutionThe bar chart given below shows the number of cars sold by brand A and B for the year for 2008 to 2016
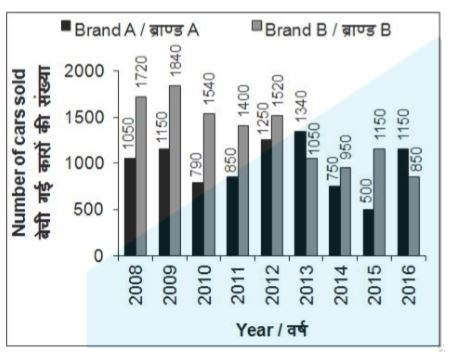
The total sales of the two brands in year 2015 is what percent of the total sales in 2016?
View Solution
