The given bar chart shows population of 4 different states in 3 years (in crores).
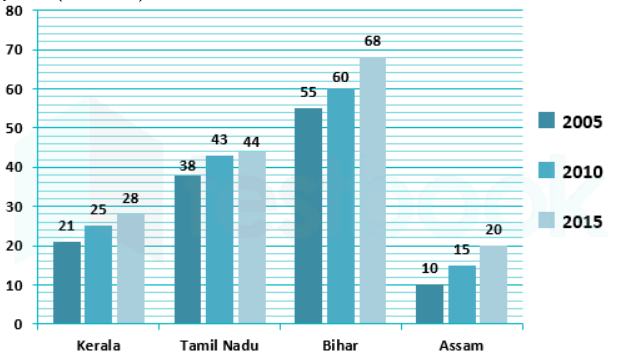
In the given bar-chart, what is the ratio of increase in population in Bihar between 2005 and 2010 to that between 2010 and 2015?
3:7
7:3
5:8
8:5
The correct Answer is:C
Step by step video & image solution for The given bar chart shows population of 4 different states in 3 years (in crores). In the given bar-chart, what is the ratio of increase in population in Bihar between 2005 and 2010 to that between 2010 and 2015? by Maths experts to help you in doubts & scoring excellent marks in Class 14 exams.
Updated on:21/07/2023Similar Questions
The given bar chart shows population of 4 different states in 3 years
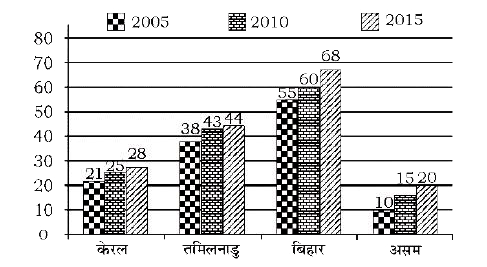
In the given bar chart, what is the ratio of increase in population in Bihar between 2005 and 2010 to that between 2010 and 2015
View SolutionThe given bar chart shows population of 4 different states in 3 years (in crores).
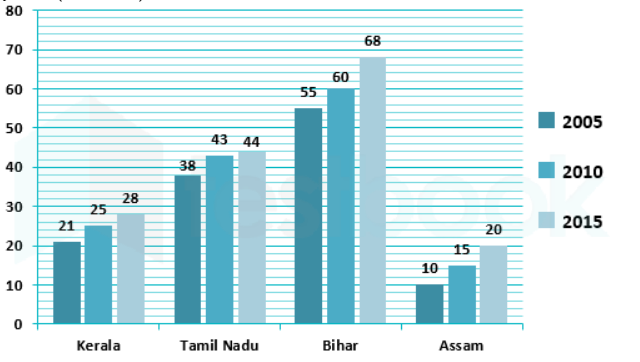
In the given bar-chart. which state has had the maximum population growth in 2015 compared to 2005.
View SolutionThe given bar chart shows population of 4 different states in 3 years (in crores).
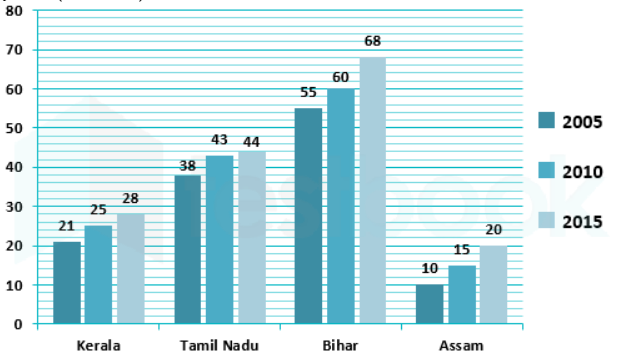
In the given bar-chart, what is the population growth (in crores) in total in states Kerala and Tamil Nadu for the period between 2005 and 2015?
View SolutionThe given bar chart shows population of 4 different states in 3 years
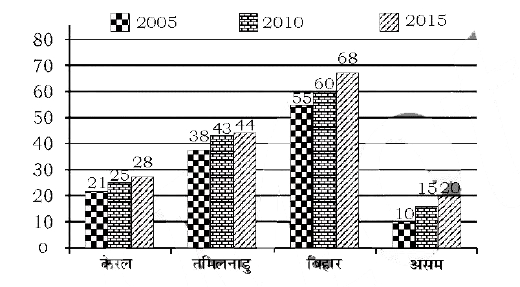
In the given bar chart, what is the population growth in total in states kerala and tamil nadu for the period between 2005 and 2015?
View SolutionThe given bar chard shows population of 4 different states in 3 years
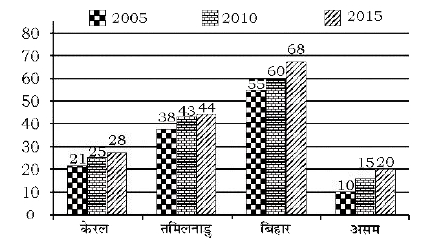
IN the given bar chart which state has had the maximum population growth in 2015 compared to 2005?
View SolutionThe given bar chart shows production of steel by companies A. B, C and D for years 2014, 2015, 2016 (in tonnes).
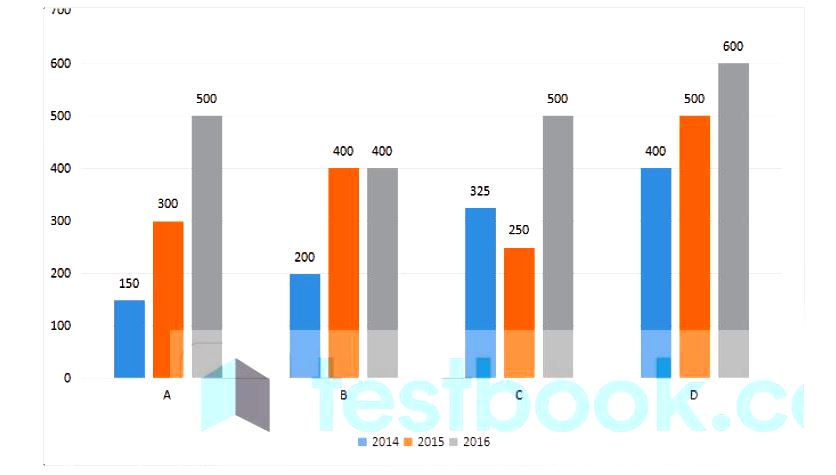
In the given bar-chart, what is the percentage production of ‘B‘ in 2014 to the total production of 2014?
View SolutionThe given bar chart, shows the sales for sets of television of three companies in three years.
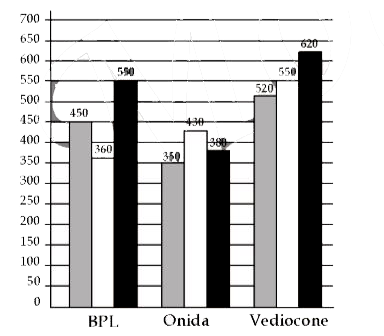
In the given bar chart what is the ratio of television sales between A in year 1992 ad C in year 1991?
View SolutionThe given bar chart shows number of marks scored by a student in each subject in three years
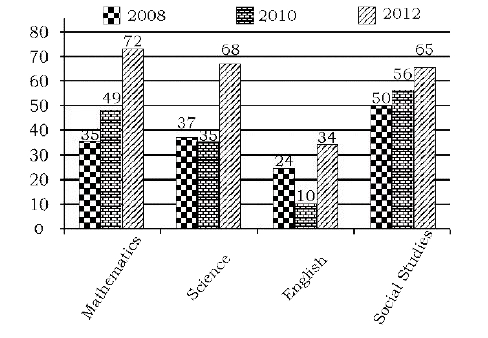
In the given bar chart what is the approximate percentage increase in marks in mathematics in 2012 compared to 2008?
View SolutionThe given bar chart shows number of marks scored by a student in each subject in three years:
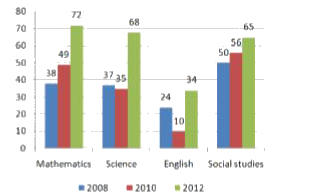
In the given bar-chart. what is the percentage increase in marks in Mathematics in 2012 compared to 2008?(round off)
View SolutionThe given bar chart, shows the sales (in thousands) for sets of televisions of three companies in three years.
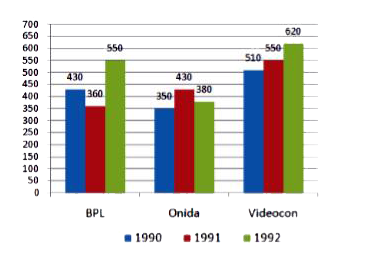
In the given bar-chart, what is the ratio of television sales between BPL in year 1992 and Videocon in year 1991?
View Solution
