The table below shows the admission and transfer in standards 1-3 of a school.

In the given table, in Standard 1, how many students were there at the end of year 2016?
223
228
236
232
The correct Answer is:A
Step by step video & image solution for The table below shows the admission and transfer in standards 1-3 of a school. In the given table, in Standard 1, how many students were there at the end of year 2016? by Maths experts to help you in doubts & scoring excellent marks in Class 14 exams.
Updated on:21/07/2023Similar Questions
The table below shows the admission and transfer in standars 1-3 of a school

IN the given table in standard 1 how many students were there at the end of year 2016
View SolutionThe table below shows the admissions and transfers in standards 1-3 of a school.

In the given table, what was the total strength in Standards 1-3 at the end of 2015?
View SolutionThe table below shows the admission and transfer in standards 1-3 of a school.

In the given table, what was the difference between admission and transfer in standard 3 in year 2016?
View SolutionThe table below shows the admission and transfer in standars 1-3 of a school

IN the given table what was the difference between admission and transfer in standard 3 in year 2016
View SolutionThe table below shows the admission and transfer in standards 1-3 of a school.

In the given table, in Standard 1, how many students were there at the end of year 2016?
View SolutionThe table below shows the admission and transfer in standards 1-3 of a school.
निम्नलिखित तालिका किसी विद्यालय की कक्षा 1-3 में नामांकन एवं स्थानांतरण को दर्शाती है | In the given table, what was the difference between admission and transfer in standard 3 in year 2016?
दी गयी तालिका के अनुसार, वर्ष 2016 में कक्षा 3 में नामांकन तथा स्थानांतरण में क्या अंतर था ?
View SolutionThe table below shows the admission and transfer in standards 1-3 of a school.
निम्नलिखित तालिका किसी विद्यालय की कक्षा 1-3 में नामांकन एवं स्थानांतरण को दर्शाती है | In the given table, what was the total strength in Standards 1-3 at the end of 2015?
दी गयी तालिका के अनुसार, 2015 के अंत में कक्षा 1-3 की कुल क्षमता क्या थी?
View SolutionThe table given below shows the months of birth of 40 students of a class in a school .

If one student is chosen at random , what is the probability that the student is born
(i) in the latter half of the year ?
(ii) in a month having 31 days ?
(iii) in a month having 30 days ?
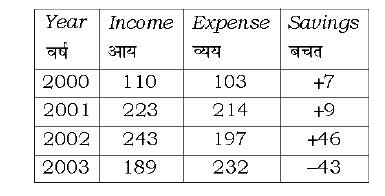
View SolutionThe table shows income and expenditure of a person for 3 years

In the given table, what is the percentage of expenditure on income in the year 2002
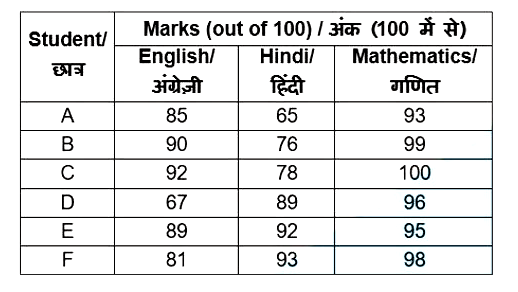
View SolutionThe table given below shows the marks obtained by 6 students in 3 subjects.

In which subject the total marks obtained by the given six students are highest?
View Solution
