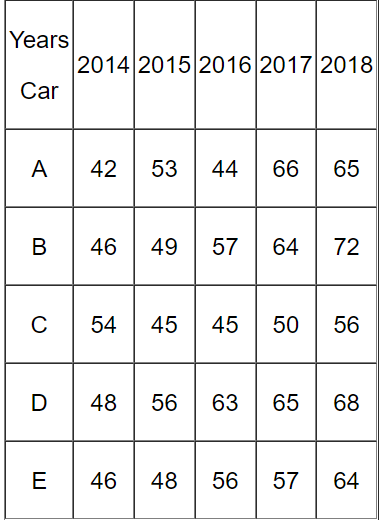
The table shows the production of different types of cars ( in thousands).

The average production of cars in is approximately what percent less than the total production of type D cars in and type B cars in taken together ?
The correct Answer is:A
Step by step video, text & image solution for The table shows the production of different types of cars ( in thousands). The average production of cars in 2018 is approximately what percent less than the total production of type D cars in 2015 and type B cars in 2017 taken together ? by Maths experts to help you in doubts & scoring excellent marks in Class 14 exams.
Updated on:21/07/2023Similar Questions
The table shows the production of different types of cars (in thousands).
 The total production of type D cars during 2015 to 2017 is what percent less than the total production of type E cars during 2014,2015,2016 and 2018 taken together?
2015 से 2017 के दौरान D प्रकार की कारों का कुल उत्पादन 2014, 2015, 2016 और 2018 में E प्रकार की कारों के कुल उत्पादन से कितना प्रतिशत कम है ?
View SolutionThe table shows the production of different types of cars (in thousands).
 The ratio of the total production of type A cars in 2015 ana type B cars in 2014 taken together to the total production of type C cars in 2017 and type E cars in 2018 taken together is:
2015 में A प्रकार की कारों के उत्पादन और 2014 में B प्रकार की कारों के उत्पादन को मिलाकर इनका अनुपात संयुक्त रूप से 2017 में C प्रकार तथा 2018 में E प्रकार की कारों के उत्पादन के साथ ज्ञात करें |
View Solution
Knowledge Check
The table shows the production of different types of cars (in thousands).
यह तालिका एक कंपनी द्वारा अलग-अलग कारों के उत्पादन (हज़ार में ) को दर्शाती है |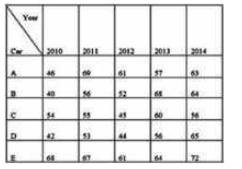 The average production of all type of cars in 2014 is approximately what percent less than the total production of type B cars in 2013 and type D cars in
2010 taken together?
2014 में सभी प्रकार की कारों का औसत उत्पादन 2013 में B प्रकार तथा 2010 में D प्रकार की कारों के कुल उत्पादन से लगभग कितना प्रतिशत कम है ?A0.418B0.449C0.432D0.444The average production of type C cars during 2012 to 2016 is approximately what percent less than the total production of type D cars in 2012 and type E cars in 2014?
A0.464B0.492C0.486D0.428The table shows the production of different types of cars (in thousands).
यह तालिका एक कंपनी द्वारा अलग-अलग कारों के उत्पादन ( हज़ार में ) को दर्शाती है |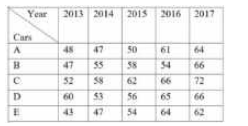 The total production of type B cars during 2013 to 2016 is approximately what percent less than the total production of cars in 2017?
2013 से 2016 के दौरान B प्रकार की कारों का कुल उत्पादन 2017 में कारों के कुल उत्पादन से लगभग कितना प्रतिशत कम है ?A0.32B0.4C0.35D0.38
The table shows the production of different types of cars (in thousands)
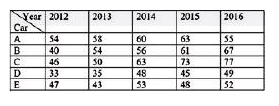
The total production of all types of cars , except type B, in 2012 is what percent less than the total production of all types of cars in 2016?
View SolutionThe table shows the production of different types of cars (in thousands).
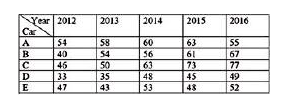
The total production of types E cars in 2012 and 2013 is approximately what percent more than the average production of type A cars during the years 2012 to 2016?
View SolutionWhat is the ratio of the total production of type A cars in 2017 and type C cars in 2014 taken together to the total production of type B cars in 2014, type C cars in 2017 and type E cars in 2018 taken together?
View SolutionThe table shows the production of different types of cars (in thousands).
यह तालिका एक कंपनी द्वारा अलग-अलग कारों के उत्पादन (हज़ार में ) को दर्शाती है | The average production of all type of cars in 2014 is approximately what percent less than the total production of type B cars in 2013 and type D cars in
2010 taken together?
2014 में सभी प्रकार की कारों का औसत उत्पादन 2013 में B प्रकार तथा 2010 में D प्रकार की कारों के कुल उत्पादन से लगभग कितना प्रतिशत कम है ?
View SolutionThe table shows the production of different types of cars ( in thousands).
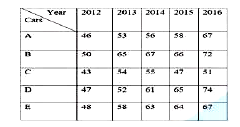
What is the ratio of the total production of type C and D cars in 2012 to the total production of type A cars in 2014 and type E cars in 2015?
View Solution
