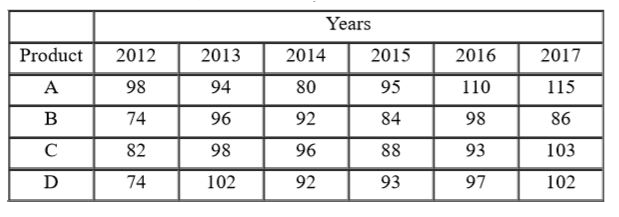
The number of years I which the revenue of the company from the sale of product D is more than the average revenue from the sale of product A over six years, is:
4
1
2
3
The correct Answer is:C
To solve the problem step by step, we need to determine how many years the revenue from the sale of product D exceeds the average revenue from the sale of product A over six years.
Step 1: Gather the Revenue Data for Product A
We are given the revenue data for product A over six years (2012 to 2017):
- 2012: 98 crores
- 2013: 94 crores
- 2014: 80 crores
- 2015: 95 crores
- 2016: 110 crores
- 2017: 115 crores
Step 2: Calculate the Total Revenue for Product A
Add the revenues for each year:
Total Revenue=98+94+80+95+110+115
Calculating the sum:
- 98+94=192
- 192+80=272
- 272+95=367
- 367+110=477
- 477+115=592
So, the total revenue for product A over six years is 592 crores.
Step 3: Calculate the Average Revenue for Product A
To find the average revenue, divide the total revenue by the number of years (6):
Average Revenue=Total Revenue6=5926
Calculating the average:
- 592÷6=98.67 (approximately)
Thus, the average revenue from the sale of product A is 98.67 crores.
Step 4: Gather the Revenue Data for Product D
Next, we need the revenue data for product D for the same years (2012 to 2017). Assume the data for product D is as follows:
- 2012: 100 crores
- 2013: 95 crores
- 2014: 99 crores
- 2015: 105 crores
- 2016: 90 crores
- 2017: 120 crores
Step 5: Compare Revenue of Product D with Average Revenue of Product A
Now, we will compare the revenue of product D for each year with the average revenue of product A (98.67 crores).
- 2012: 100 > 98.67 ✔️
- 2013: 95 < 98.67 ❌
- 2014: 99 > 98.67 ✔️
- 2015: 105 > 98.67 ✔️
- 2016: 90 < 98.67 ❌
- 2017: 120 > 98.67 ✔️
Step 6: Count the Years
Count the years where the revenue from product D is greater than the average revenue of product A:
- The years are: 2012, 2014, 2015, and 2017.
Thus, the total count of years is 4.
Final Answer
The number of years in which the revenue of the company from the sale of product D is more than the average revenue from the sale of product A is 4.
---
We are given the revenue data for product A over six years (2012 to 2017):
- 2012: 98 crores
- 2013: 94 crores
- 2014: 80 crores
- 2015: 95 crores
- 2016: 110 crores
- 2017: 115 crores
Add the revenues for each year:
Total Revenue=98+94+80+95+110+115
- 98+94=192
- 192+80=272
- 272+95=367
- 367+110=477
- 477+115=592
To find the average revenue, divide the total revenue by the number of years (6):
Average Revenue=Total Revenue6=5926
- 592÷6=98.67 (approximately)
Next, we need the revenue data for product D for the same years (2012 to 2017). Assume the data for product D is as follows:
- 2012: 100 crores
- 2013: 95 crores
- 2014: 99 crores
- 2015: 105 crores
- 2016: 90 crores
- 2017: 120 crores
Now, we will compare the revenue of product D for each year with the average revenue of product A (98.67 crores).
- 2013: 95 < 98.67 ❌
- 2014: 99 > 98.67 ✔️
- 2015: 105 > 98.67 ✔️
- 2016: 90 < 98.67 ❌
- 2017: 120 > 98.67 ✔️
Count the years where the revenue from product D is greater than the average revenue of product A:
- The years are: 2012, 2014, 2015, and 2017.
The number of years in which the revenue of the company from the sale of product D is more than the average revenue from the sale of product A is 4.
Similar Questions
The given table represents the revenue (in ₹ crores) of a company from the sale of four products A,B,C and D in 6 years. Study the table carefully and answer the questions that follow.
दी गयी तालिका एक कंपनी को चार उत्पादों -A, B, C तथा D की बिक्री से 6 वर्षों में होने वाली आय ( करोड़ रुपये में ) को दर्शाती है | इस तालिका का ध्यानपूर्वक अध्ययन करें तथा फिर पूछे गए प्रश्नों का उत्तर दें The number of years in which the revenue of the company from the sale of product D is more than the average revenue from the sale of product A over the six years is:
ऐसे कितने वर्ष हैं जिनमें उत्पाद D की बिक्री से कंपनी को होने वाली आय इन छः वर्षों के दौरान उत्पाद A की बिक्री से हुई औसत आय से अधिक है ?View SolutionIn how many years, the revenue of the firm is less than the average revenue for these 8 years?
View Solution
Knowledge Check
- Question 1 - Select One
The given table represents the revenue (in Rs. Crores) of a company from the sale of four products A, B, C and D in 6 year . Study the table carefully and answer the question that following.
By what percentage is the total revenue of the company from the sale of products A, B and D in 2012 and 2013 more tha the total revenue from the sale of product B in 2013 to 2016?
 A31.2B45.4C44.5D43.6
 - Question 2 - Select One
The given table represents the revenue (in ₹ crores) of a company from the sale of four products A,B,C and D in 6 years. Study the table carefully and answer the questions that follow.
दी गयी तालिका एक कंपनी को चार उत्पादों -A, B, C तथा D की बिक्री से 6 वर्षों में होने वाली आय ( करोड़ रुपये में ) को दर्शाती है | इस तालिका का ध्यानपूर्वक अध्ययन करें तथा फिर पूछे गए प्रश्नों का उत्तर दें The total revenue of the company from the sale of products B,C and D in 2014 is what percentage of
the total revenue from the sale of products C and D in 6 years?
2014 में उत्पाद B, C और D की बिक्री से कंपनी को हुई कुल आय 6 वर्षों में उत्पाद C और D की बिक्री से हुई कुल आय का कितना प्रतिशत है?A18B20C25D28 - Question 3 - Select One
A rectangular plot is 180m^2 in area. If its length is 18m, then its perimeter is?
Aa. 28mBb. 56mCc. 360mDd. 60m
The table shows the production of different types of cars (in thousands).
यह तालिका अलग-अलग प्रकार के कारों का उत्पादन ( हज़ार में) दर्शाती है |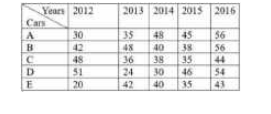 The number of years, in which the production of cars of type B is less than the average production of type D cars over the years is:
कितने वर्ष B प्रकार की कारों का उत्पादन इन वर्षों के दौरान D प्रकार की कारों के औसत उत्पादन से कम रहा है ?View SolutionThe line chart given below shows the revenue of a company (in lac rupees) from year 2009 to 2016
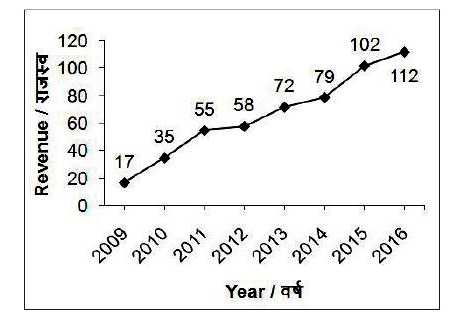
The average revenue of the company from 2013 to 2016 is how much percent more than the average revenue of the company from 2009 to 2012?View SolutionThe line chart given below shows the revenue of a company (in lac rupees) from year 2009 to 2016.
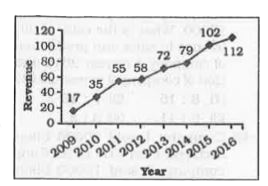
The averange revenue of the company from 2013 to 2016 is how much per cent more than the average revenue of the company from 2009 to 2012?View SolutionThe given table represents the number of engineers recruited by four companies A,B,C and D over the years. Study the table carefully and answer the questions that follows: The number of years in which the number of engineers recruited by company D is less than the average number of engineers recruited by company B in the given six years, is:
दी गयी तालिका चार कंपनियों A, B, C और D के द्वारा इन वर्षों के दौरान भर्ती किये गए इंजीनियरों की संख्या दर्शाती है | इस तालिका का ध्यानपूर्वक अध्ययन करें तथा इसके बाद पूछे गए प्रश्न का उत्तर दें |
ऐसे कितने वर्ष हैं जिनमें कंपनी D के द्वारा भर्ती किये गए इंजीनियरों की संख्या दिए गए छः वर्षों की अवधि में कंपनी B के द्वारा भर्ती किये गए इंजीनियरों की औसत संख्या से कम है?View SolutionStudy the following bar graph and answer the question given
निम्नलिखित दंड-आरेख (बार-ग्राफ) का अध्ययन कीजिए तथा दिए गए प्रश्न का उत्तर दीजिए: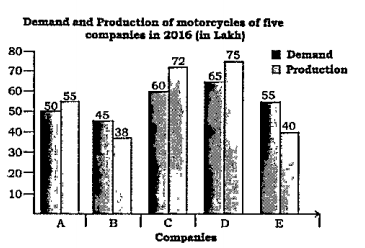 The number of companies whose production of motorcycles in equal to or more than the average demand of motorcycles (per year) over five years is:
उन कंपनियों की संख्या बताइए,जिनके द्वारा मोटरसाइकिलों का उत्पादन, पांच वर्षों में मोटरसाइकिलों की औसत मांग (प्रति वर्ष) के बराबर या अधिक है?View Solution

