The following bar graph shows information on the sales of the personal computers by the company ''XYZ'' for the last 10 years.
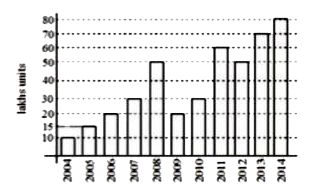
How many units (lakhs) of personal computers were sold by the company XYZ in 2009 ?
(a)15
(b)20
(c)10
(d)30
15
20
10
30
The correct Answer is:B
Step by step video, text & image solution for The following bar graph shows information on the sales of the personal computers by the company ''XYZ'' for the last 10 years. How many units (lakhs) of personal computers were sold by the company XYZ in 2009 ? (a)15 (b)20 (c)10 (d)30 by Maths experts to help you in doubts & scoring excellent marks in Class 14 exams.
Updated on:21/07/2023Similar Questions
The given bar graph shows the number of cars sold from Jan to Dec.
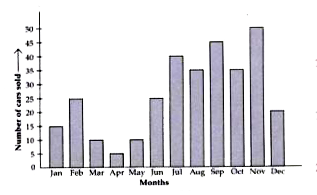
How many cars were sold in the last quarter of the year?
View SolutionThe following Bar chart shows the sales of a company XYZ (in Rs Crore). Study the chart and answer the following questions.
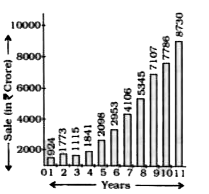
The 2nd least sale is in the year :
View Solution
Knowledge Check
The following bar graph shows infomiation on the sales of the personal computers by the company "XYZ" for the last 10 year?
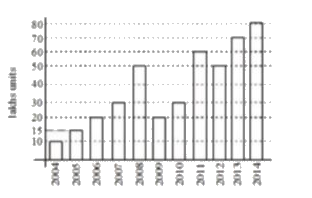
How many units of personal computers were sold by the company XYZ in 2011?
(a)60
(b)50
(c)80
(d)70A60B50C80D70The following Bar graph shows information of the results in the national level entrance exam by the institute ''ABC'' for the last 5 years.
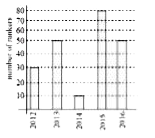
In the year 2015, how many ranks were scored from institute ''ABC'' ?A90B80C60D70Study the following table carefully and answer the following question
The following tables gives the information of sales of sports kits by the company ''XYZ'' over past five years (numbers in lakhs)
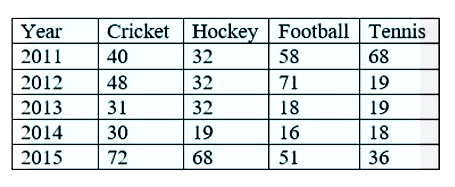
For which game the sales of the sports kit was consistently same for three years?ATennisBCricketCFootballDHockey
Study the following table carefully and answer the following question The following tables gives the information of sales of sports kits by the company "XYZ" over past five years (numbers in lakhs):

For hockey what is the total sales for past 5 years ?
View SolutionThe line chart given below shows the sales (in crores) of a company for the years 2009 to 2016
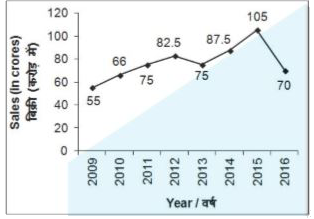
In how many years was the sale of the company a multiple of 10 crores?
View SolutionThe following graph shows the production of cotton cloth (in lakh metres) by three companies A, B and C over the years.
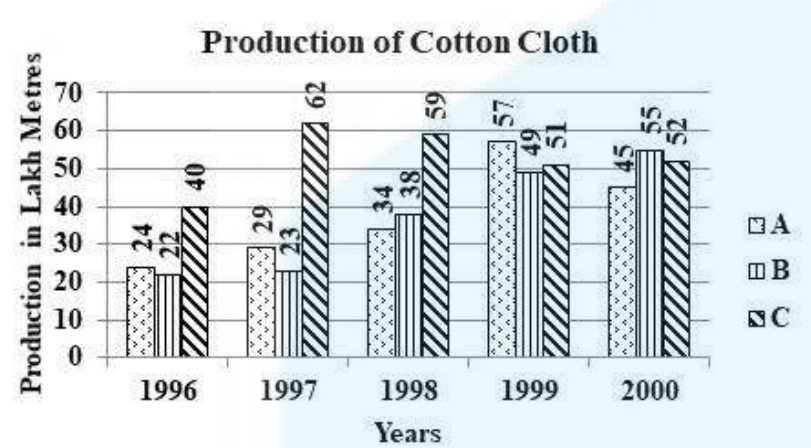
What is the ratio of the production of Company C in the years 1996 and 1997 to the production of Company B in the years 1999 and 2000?
View SolutionThe following pie chart shows information on sales of a toy making company "XYZ" during 2017-18 financial year
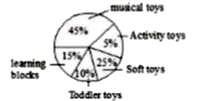
The total revenue made by sales of the toys was 38,72,000/-, How much revenue did the musical toys make?
View SolutionThe following pie chart shows information on sales of a toy making company 'XYZ' for 2017-18 financial year

The total revenue made by sales of the toys is Rs 38,72,000/-
Which type of toys made least revenue for the company?
(a)Musical toys
(b)Activity toys
(c)Learning blocks
(d)Soft toys
View Solution
