The sales of pens in 2012 is how much percent to the sales of pens in 2013, 2014.
60%
75%
70%
80%
The correct Answer is:B
Similar Questions
The bar chart represents sales of four companies C1, C2, C3 and C4 (in millions) for the year 2012 , 2013 and 2014 Consider the bar chart and answer questions based on it .
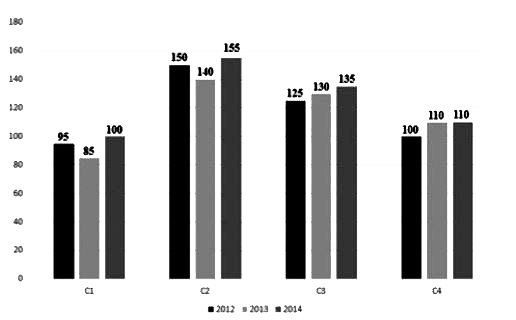
The combined sales of C2 in 2012 and 2014 is how much more than that of C3 for the same years ?
A. 12%
B. 13.75%
C. 14.75%
D. 17.30%View SolutionDirection: The given bar graph shows the number of pens sold by two shops A & B in four consecutive months. Study the following data and answer the following questions:
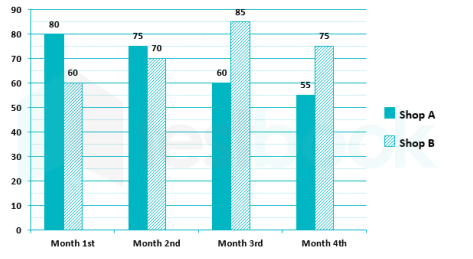
Find that the number of pens sold by shop A in 1st month is how much percent more than the number of pens sold by shop A in 3rd month.View Solution
Knowledge Check
- Question 1 - Select One
The sale of pens in 2014 is decreased by how much percent to the sale of pen in 2012.
A20%B15%C30%D25% - Question 2 - Select One
The bar chart given below shows the sales (in lacs) of 2 companies X and Y and Y from year 2011 to 2016
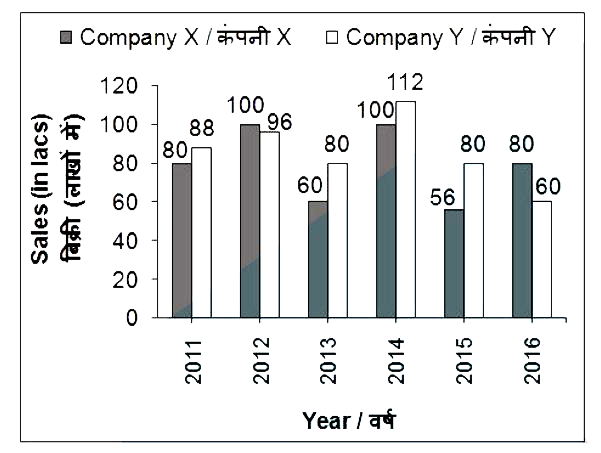
The sale of company Y in 2015 is what percent of the sale of company X in 2011?A80B100C250D300 - Question 3 - Select One
The line chart given below shows the sales (in crores) of company A and B from July to December.
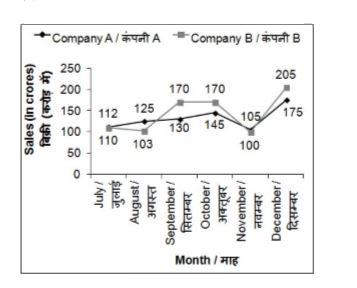
The sales of company A in November is how much percent more than the sales of company B in November?A5B10C8D15
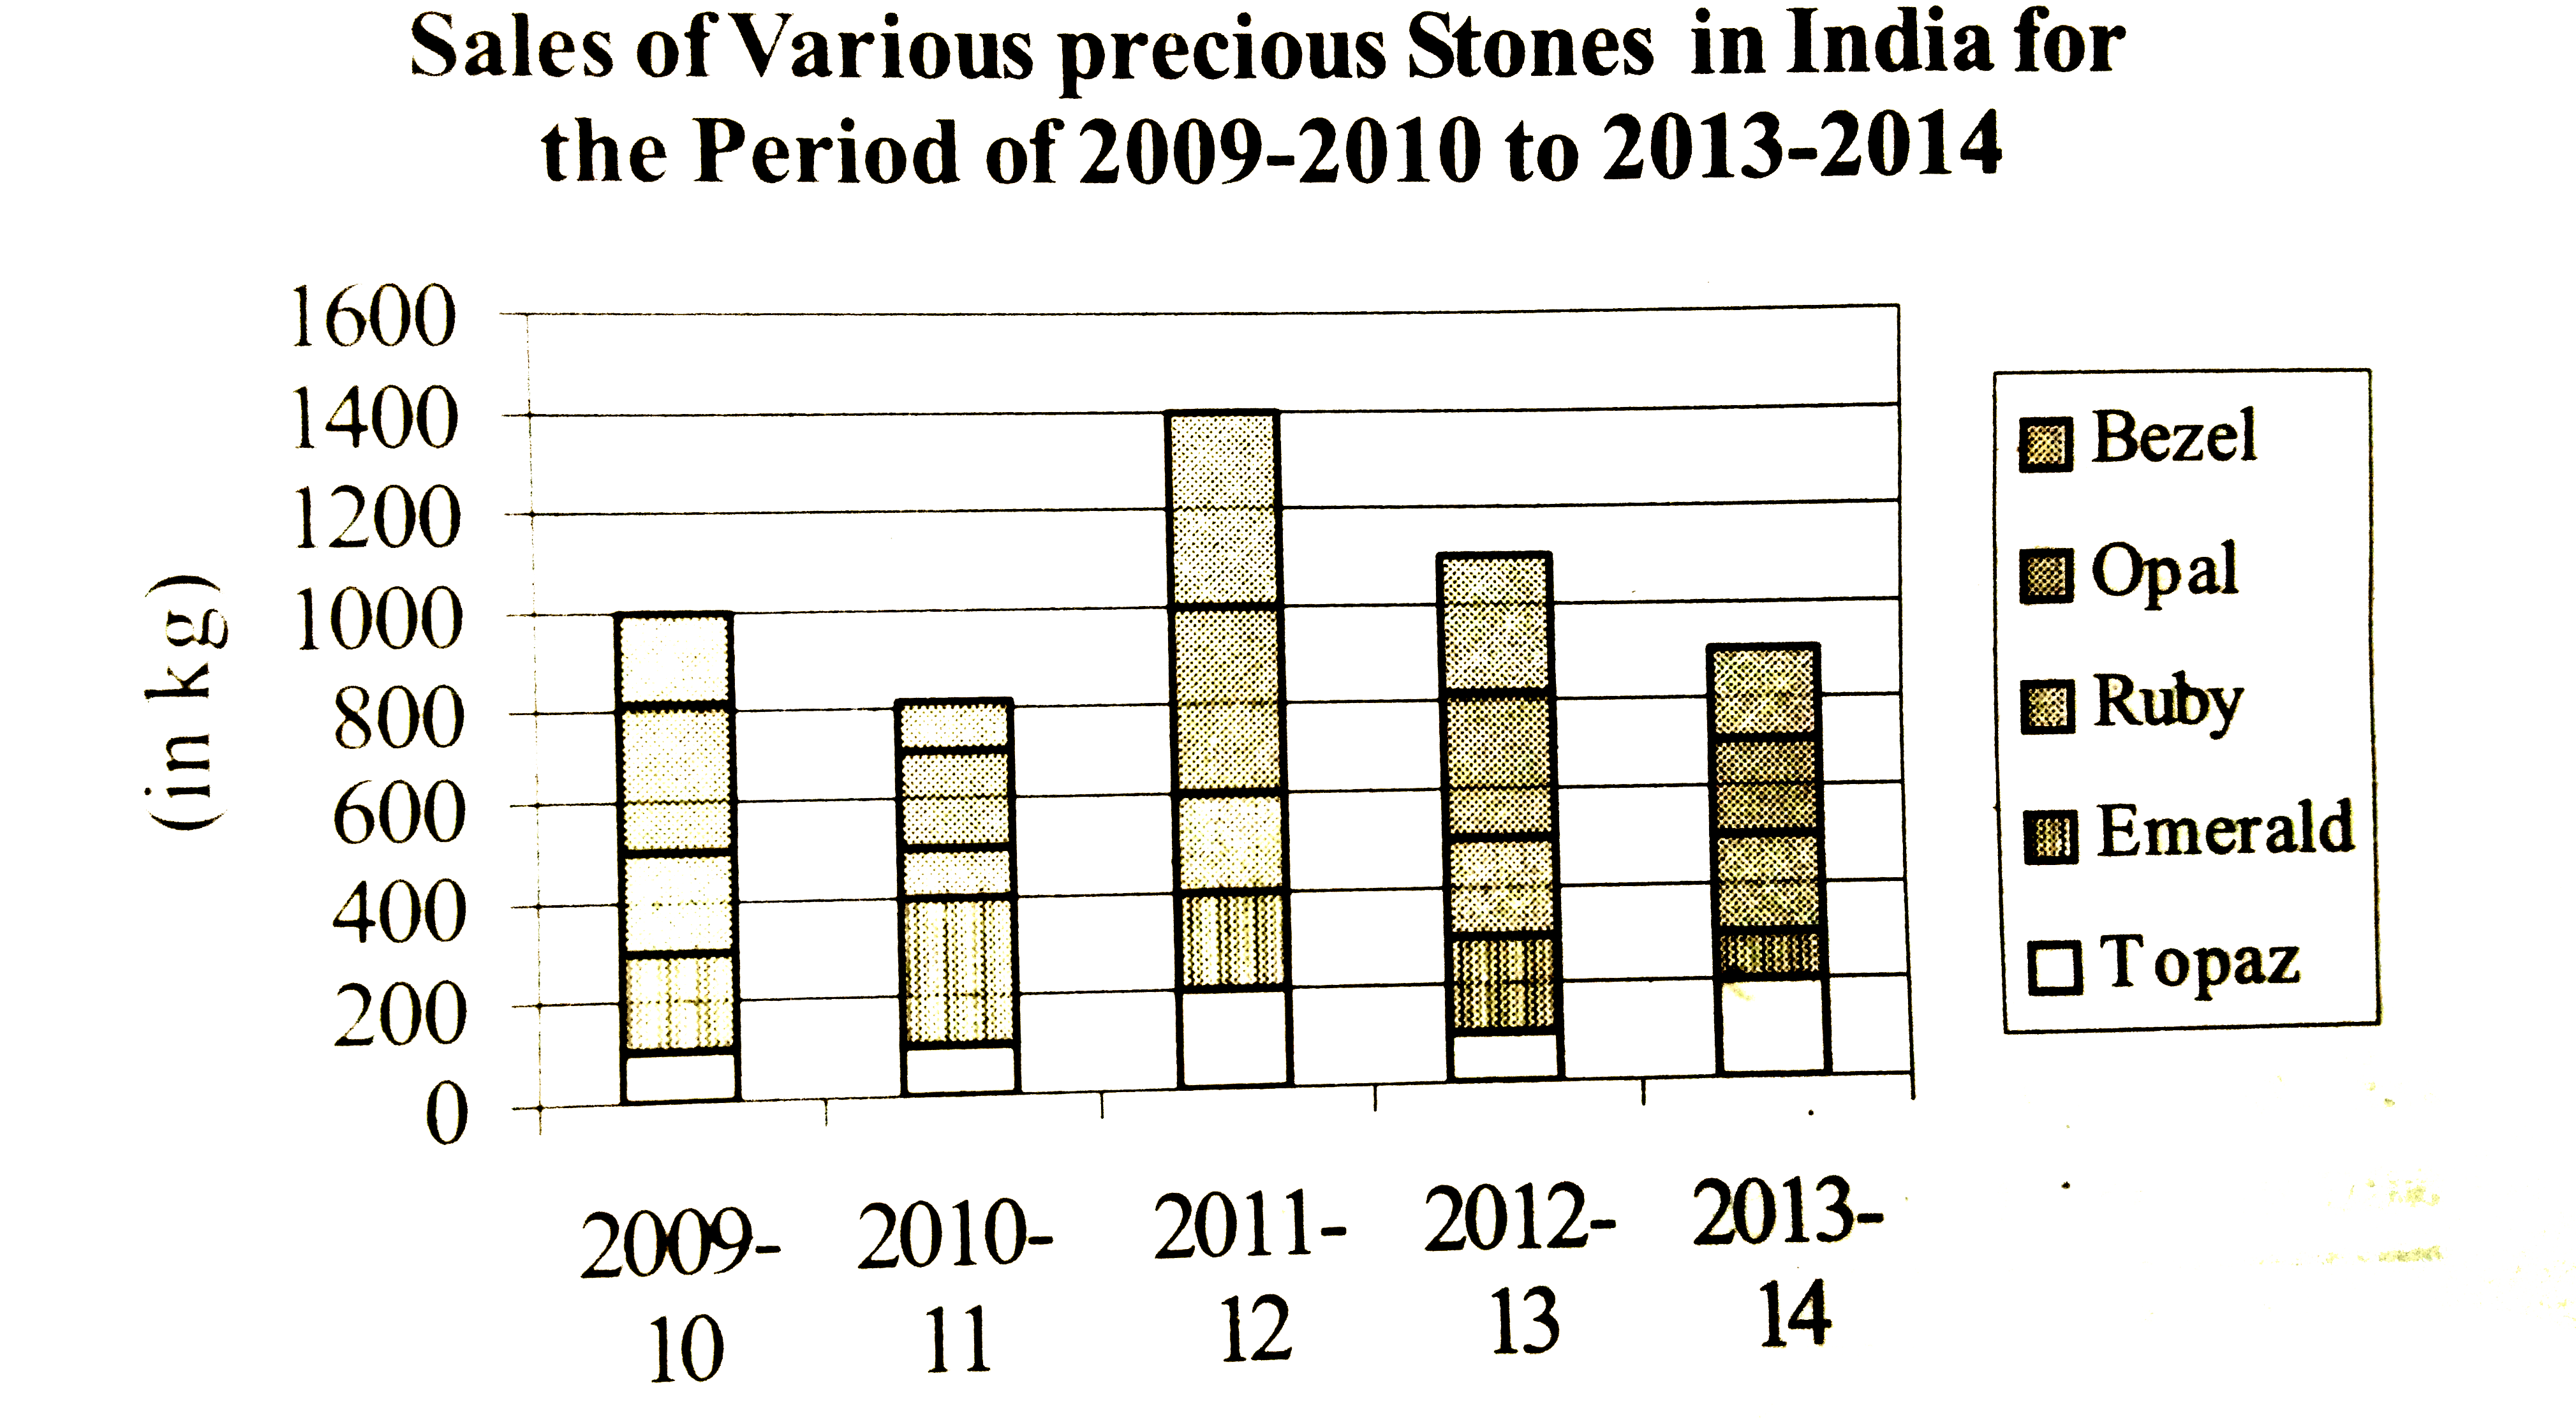
By what percent is the average annual sales of Eamerald for the given period more than the sales of Opal in 2012-13?View SolutionThere are two car manufacturing companies (Company X and Company Y). The sale of cars by these two different companies is given in different years.
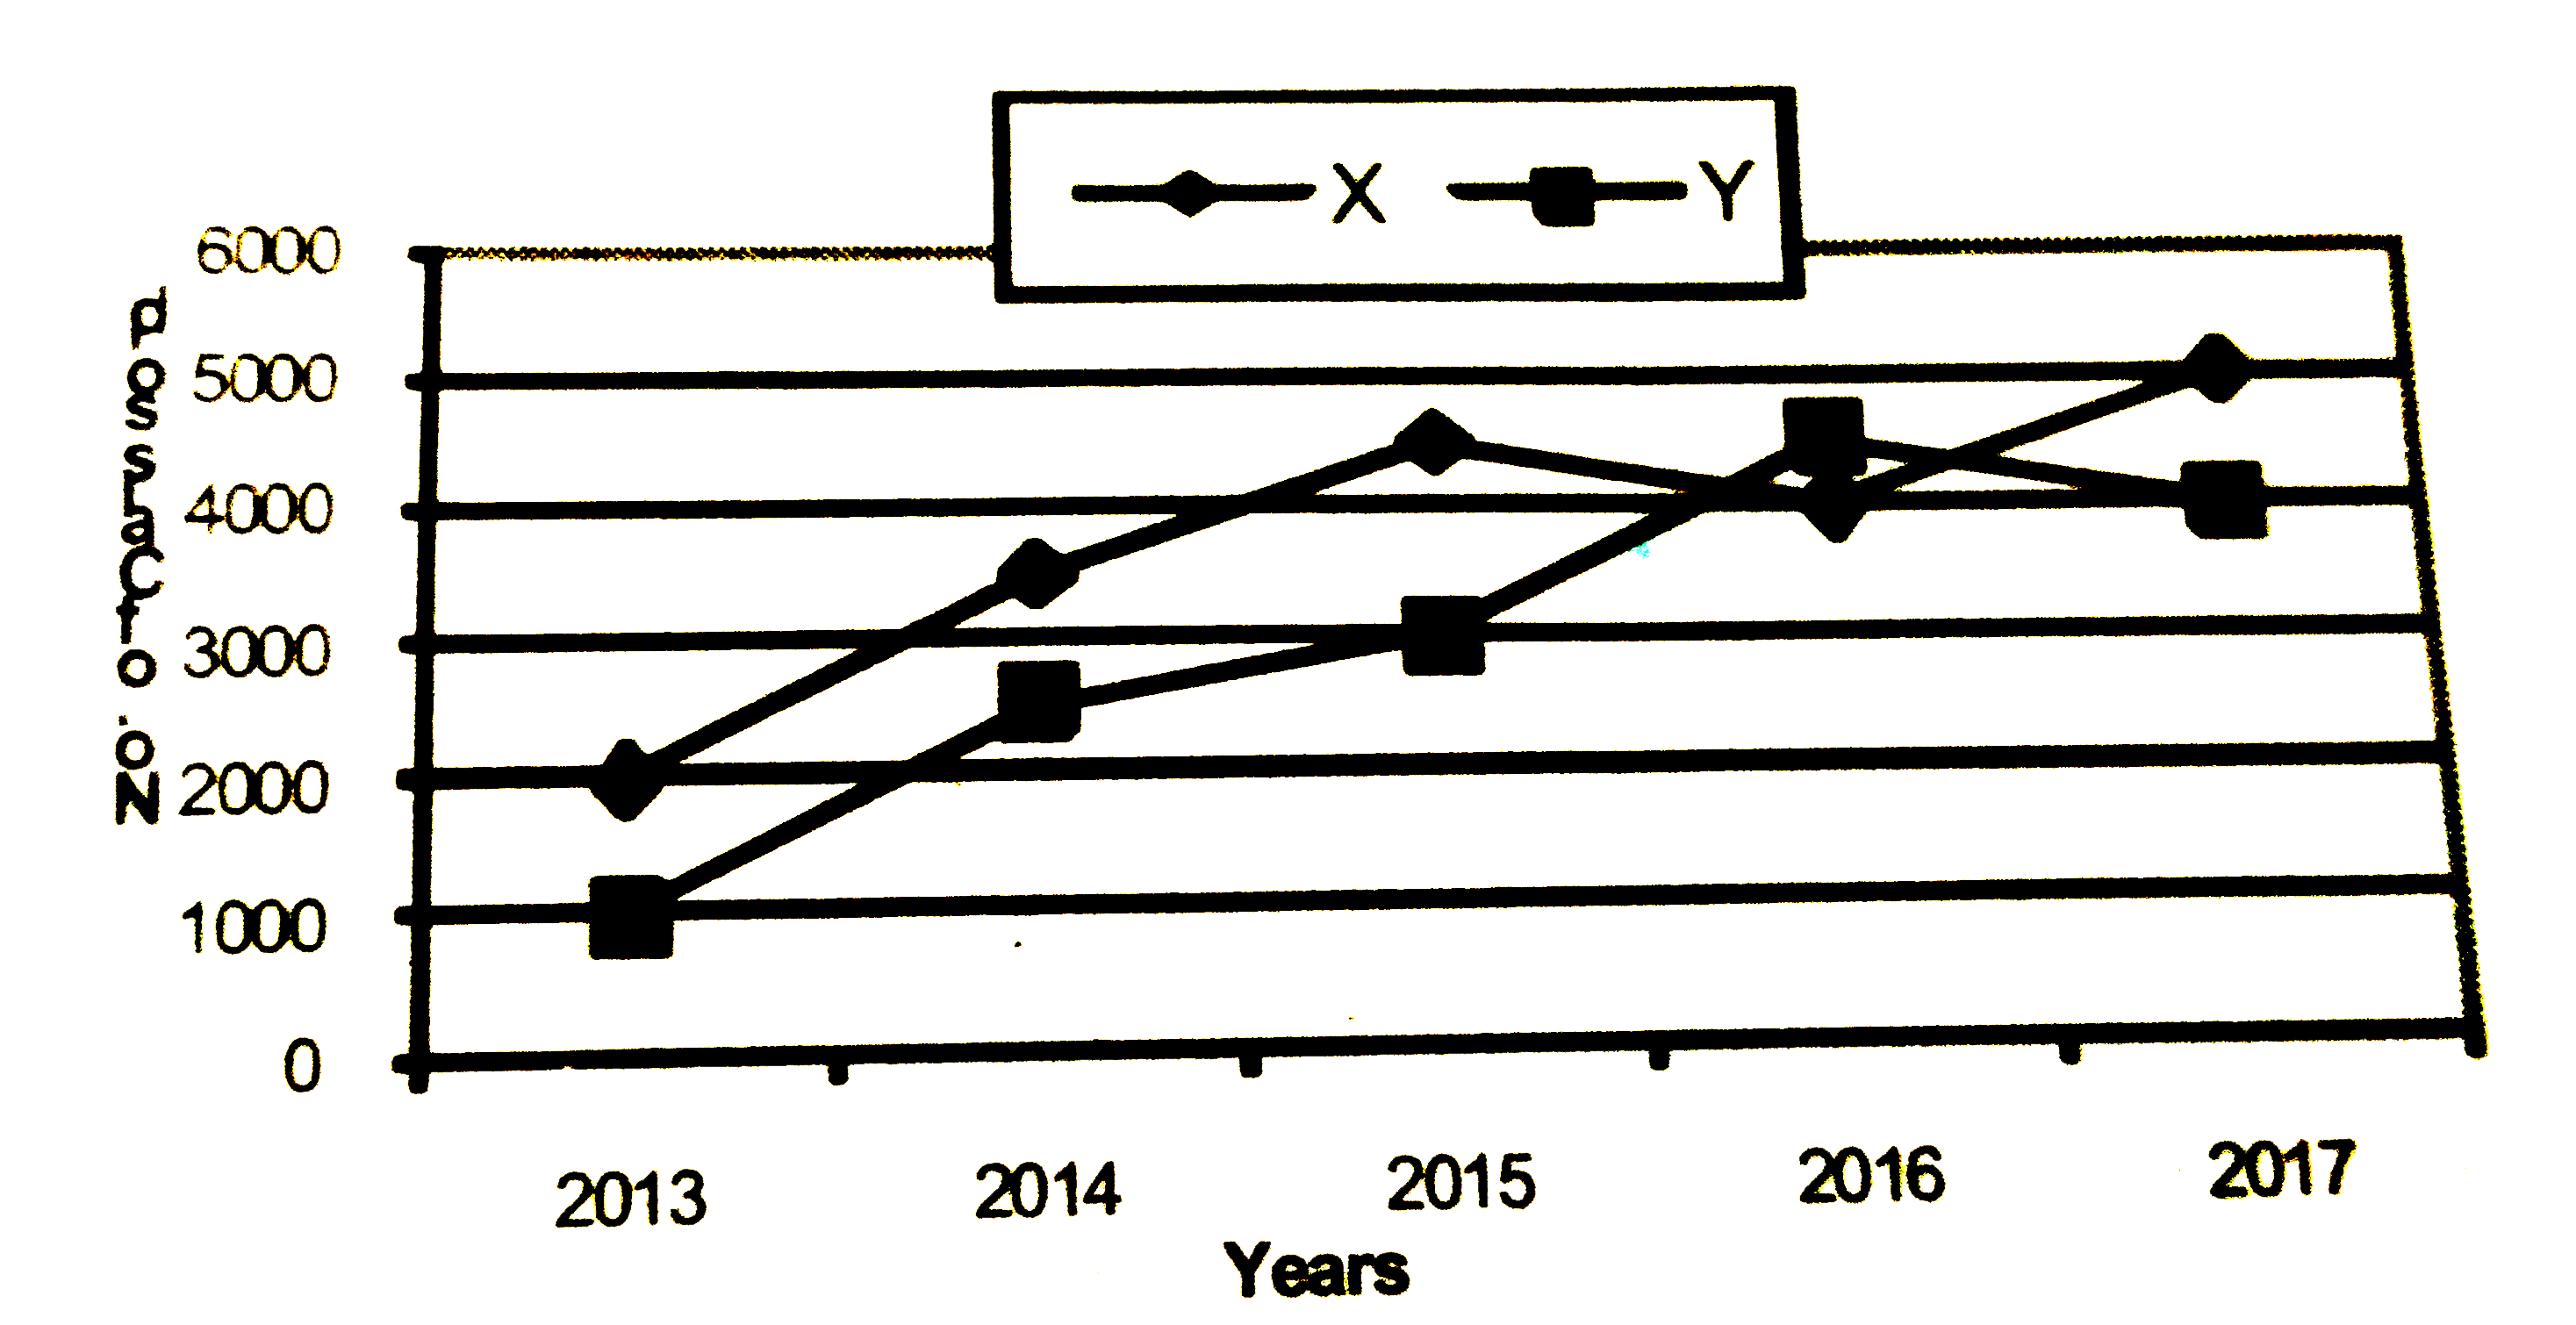
Find the ratio of the sales of company X in years 2013, 2015 and 2017 together to the total sale of company Y in year 2014 and 2016 ? together ?View SolutionThe following questions are based on the bar graph given below which represents the Jan Dhan accounts opened in different years 2010, 2011, 2012, 2013. (All the accounts opened data are in thousands)
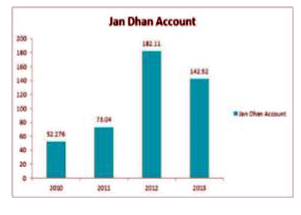
The total accounts opened in 2013 is decreased by how much percent to the total accounts opened in 2012.View SolutionThe line chart given blow represents the sales (in 00) of trousers ans shirts for five months.
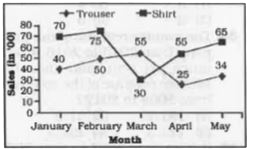
Total sale of shirts for five months is how much per cent more than the total sale of trousers for five months?View SolutionThe given Bar graph presents the Export of Tea and Coffe ( in million kg ) for the years 2012 to 2016.
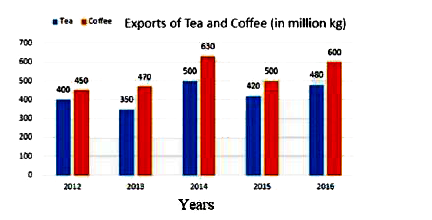
What is thr ratio of total export of tea in 2012 , 2014 and 2015 to the total export of coffee in 2013 and 2014 ?View Solution

