Find the average of pens sold in all years.
46000
46700
45000
48400
The correct Answer is:B
Similar Questions
Directions: Study the Pie chart and answer the following question. The pie chart is showing the percentage of different types of shirts sold by five different stores namely A, B, C, D and E.
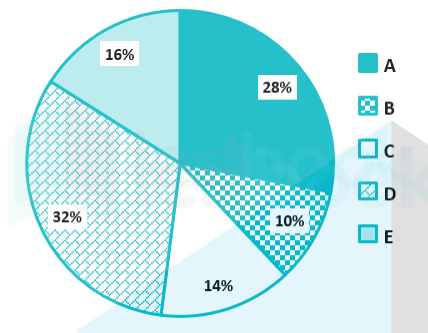
Find the average of shirt sold by all stores. If the shirt sold by store B is 1750.View SolutionIn a class, the number of boys and girls are distinct. The average age of all the student in the class equals the average of the average age of the boys and the average age of the girls. The sum of the average age of the boys and the average age of the girls is 10 years. Find the average age (in years) of the boys of the class
View Solution
Knowledge Check
- Question 1 - Select One
The following charts shows the sales (in thousands) of pens , pencils and books in month1 , month2 and month3 . Answer the question based on the chart .
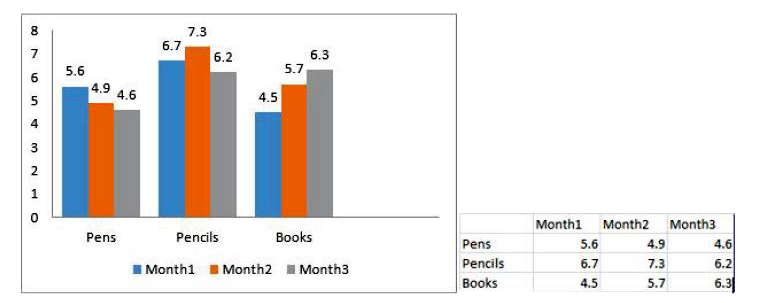
What is the average number of pens sold in the 3 months ?A3987B4935C5033D5432 - Question 2 - Select One
Study the table carefully to answer the questions that follow-
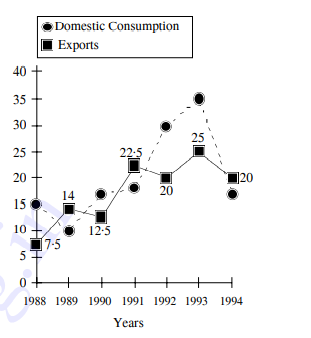
What is the approximate average number of units sold in the year 1999?A407300000B4040000C42740000D4073000000 - Question 3 - Select One
In a colony, the average age of the boys is 14 years and the average age of the girls is 17 years. If the average age of the children in the colony is 15 years, find the ratio of number of boys to that of girls.
A1:2B2:1C2:3D3:2
The average age of an adult class is 40 years. 12 new students with an average age of 32 years join the class, thereby decreasing the average of the class by 4 years. Find the original strength of the class
View SolutionDirection: The given bar graph shows the number of pens sold by two shops A & B in four consecutive months. Study the following data and answer the following questions:
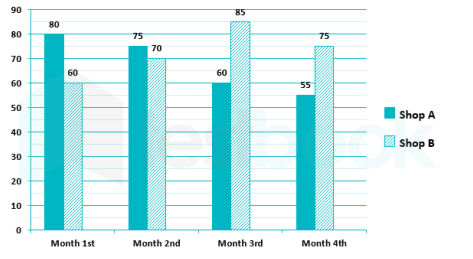
Find the average of the number of pens sold by shop A in 1st and 3rd months and the number of pens sold by shop B in 3rd and 4th month together.View SolutionAverage cost of 10 pens is Rs.200 and average cost of 10 pencil is Rs.100. Find the average cost of all pens and pencils.
View SolutionBar graph given below shows pens sold by a retailor on five different days. Study the data carefully and answer the following questions.
Pen sold on different days
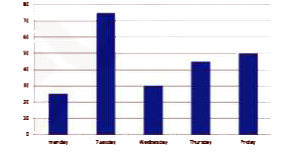
Total number of pens sold on Saturday is 40% more than total number of pens sold on Wednesday. Find total number of pens sold on Friday and Saturday together?View SolutionIf 5% of the total number of cars sold of model E is 750, then what is the average number of cars sold of all the models?
View Solution
