Study the following diagram and answer questions based on it
The diagram represents the favourite ice-cream flavours of kids in a society
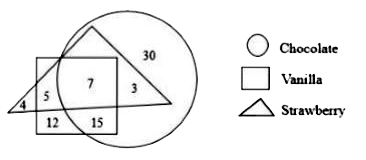
The ratio of kids who like Vanilla to those who like Chocolate is
A. 12/30
B. 39/45
C. 27/45
D. 39/55
C
A
D
B
The correct Answer is:C
Step by step video & image solution for Study the following diagram and answer questions based on it The diagram represents the favourite ice-cream flavours of kids in a society The ratio of kids who like Vanilla to those who like Chocolate is A. 12/30 B. 39/45 C. 27/45 D. 39/55 by Reasoning experts to help you in doubts & scoring excellent marks in Class 14 exams.
Updated on:21/07/2023Similar Questions
Study the following diagram and answer questions based on it
The diagram represents the favourite ice-cream flavours of kids in a society
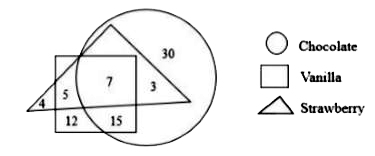
How many kids like Strawberrt but not Vanilla ?
A. 4
B. 5
C. 7
D. 3
View SolutionStudy the following diagram and answer questions based on it
The diagram represents the favourite ice-cream flavours of kids in a society
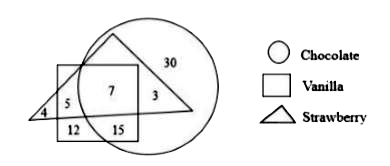
How many kids like both Chocolate and Vanilla but not Strawberry ?
A. 5
B. 7
C. 12
D. 15
View Solution
Knowledge Check
Study the following diagram and answer questions based on it
The diagram represents the liked of kids of a class.
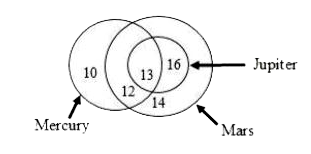
The ratio of kids who like only Mars to those who like all the three is
A. 7/5
B. 7/8
C. 7/6
D. 14/13ADBCCADBStudy the following diagram and answer questions based on it.
The diagram represents the likes of children in a society
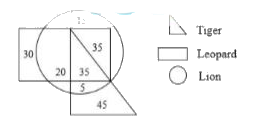
The difference between children who like leopard to those who like tiger is
A. 50
B. 35
C. 30
D. 5ABBACDDCStudy the following diagram and answer questions based on it.
The diagram represents the likes of children in a society.
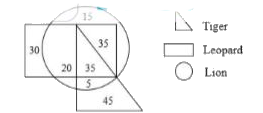
How many children who like lion, also like the tiger?
A. 5
B. 15
C. 35
D. 40ACBDCADB
Study the following diagram and answer questions based on it
How many people who like Mars like Jupiter also ?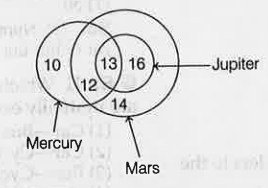
View SolutionStudy the following diagram and answer questions based on it
What is the difference between the kids who like Mercury and Jupiter?
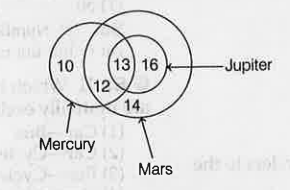
View SolutionStudy the following diagram and answer questions based on it
The ratio of kids who like only Mars to those who like all the three is.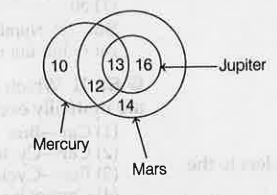
View SolutionStudy the following diagram and answer questions based on it.
The colour preferences of children are given
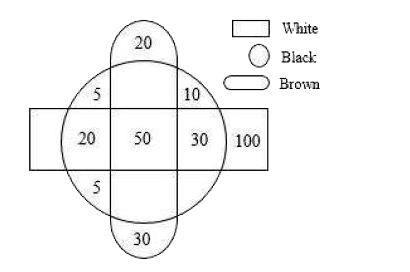
The ratio of children who like brown to those who like black is
A. 5/3
B. 1/2
C. 1
D. 5/6
View SolutionStudy the following diagram and answer questions based on it.
The diagram represents the likes of children in a society.
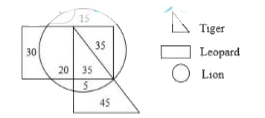
How many children like both lion and leopard?
A. 35
B. 55
C. 90
D. 95
View Solution
