The given histogram shows the height of the students.
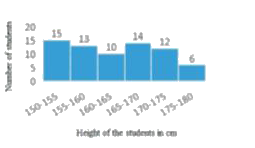
The difference between the number of students whose height is between 150-155 cm and the students whose height lies between 175-180 cm is :
8
9
3
7
The correct Answer is:B
Step by step video, text & image solution for The given histogram shows the height of the students. The difference between the number of students whose height is between 150-155 cm and the students whose height lies between 175-180 cm is : by Maths experts to help you in doubts & scoring excellent marks in Class 14 exams.
Updated on:21/07/2023Similar Questions
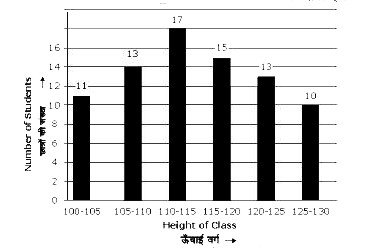
The given histogram shows the height of the students.
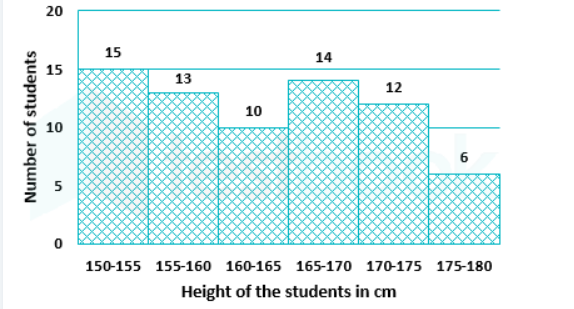
The number of students whose height is in the class interval 165-170 is what percentage less than the number of students whose height is in the interval 150- 155? (correct to one decimal place)
View SolutionThe given histogram shows the height of the students.
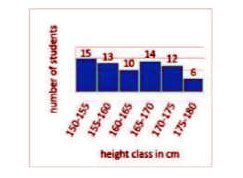
What is the percentage of students whose height is in the class interval 165-175? (correct to the nearest integer)
View Solution
Knowledge Check
The given histogram shows the height of the students
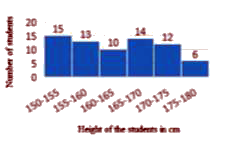
The number of students whose height is in the class interval 170-175 is what percent less than the number of students whose height is in the interval 165-170 ? (correct to one decimal place)A0.115B0.173C0.143D0.195The number of student, whose marks lie between 40.5 and 50.5 is
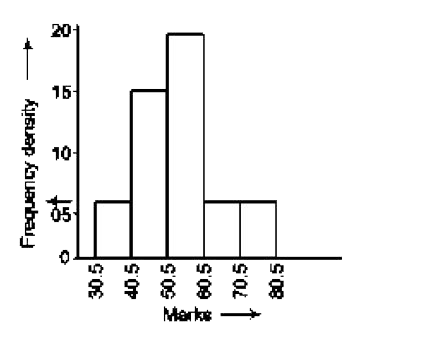 A15B10C5DNone of these
The given histogram shows the height of the students.
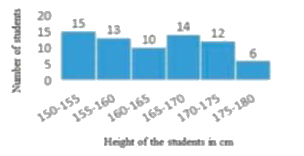
What is the percentage of students whose height is in the class interval 160-170 ? (correct to the nearest integer)A39B34C25D5
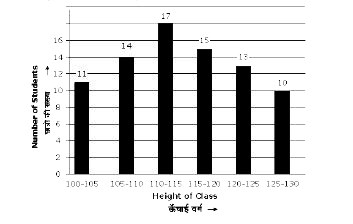
In the given histogram, what is the mean height of all students to one decimal place.
View Solution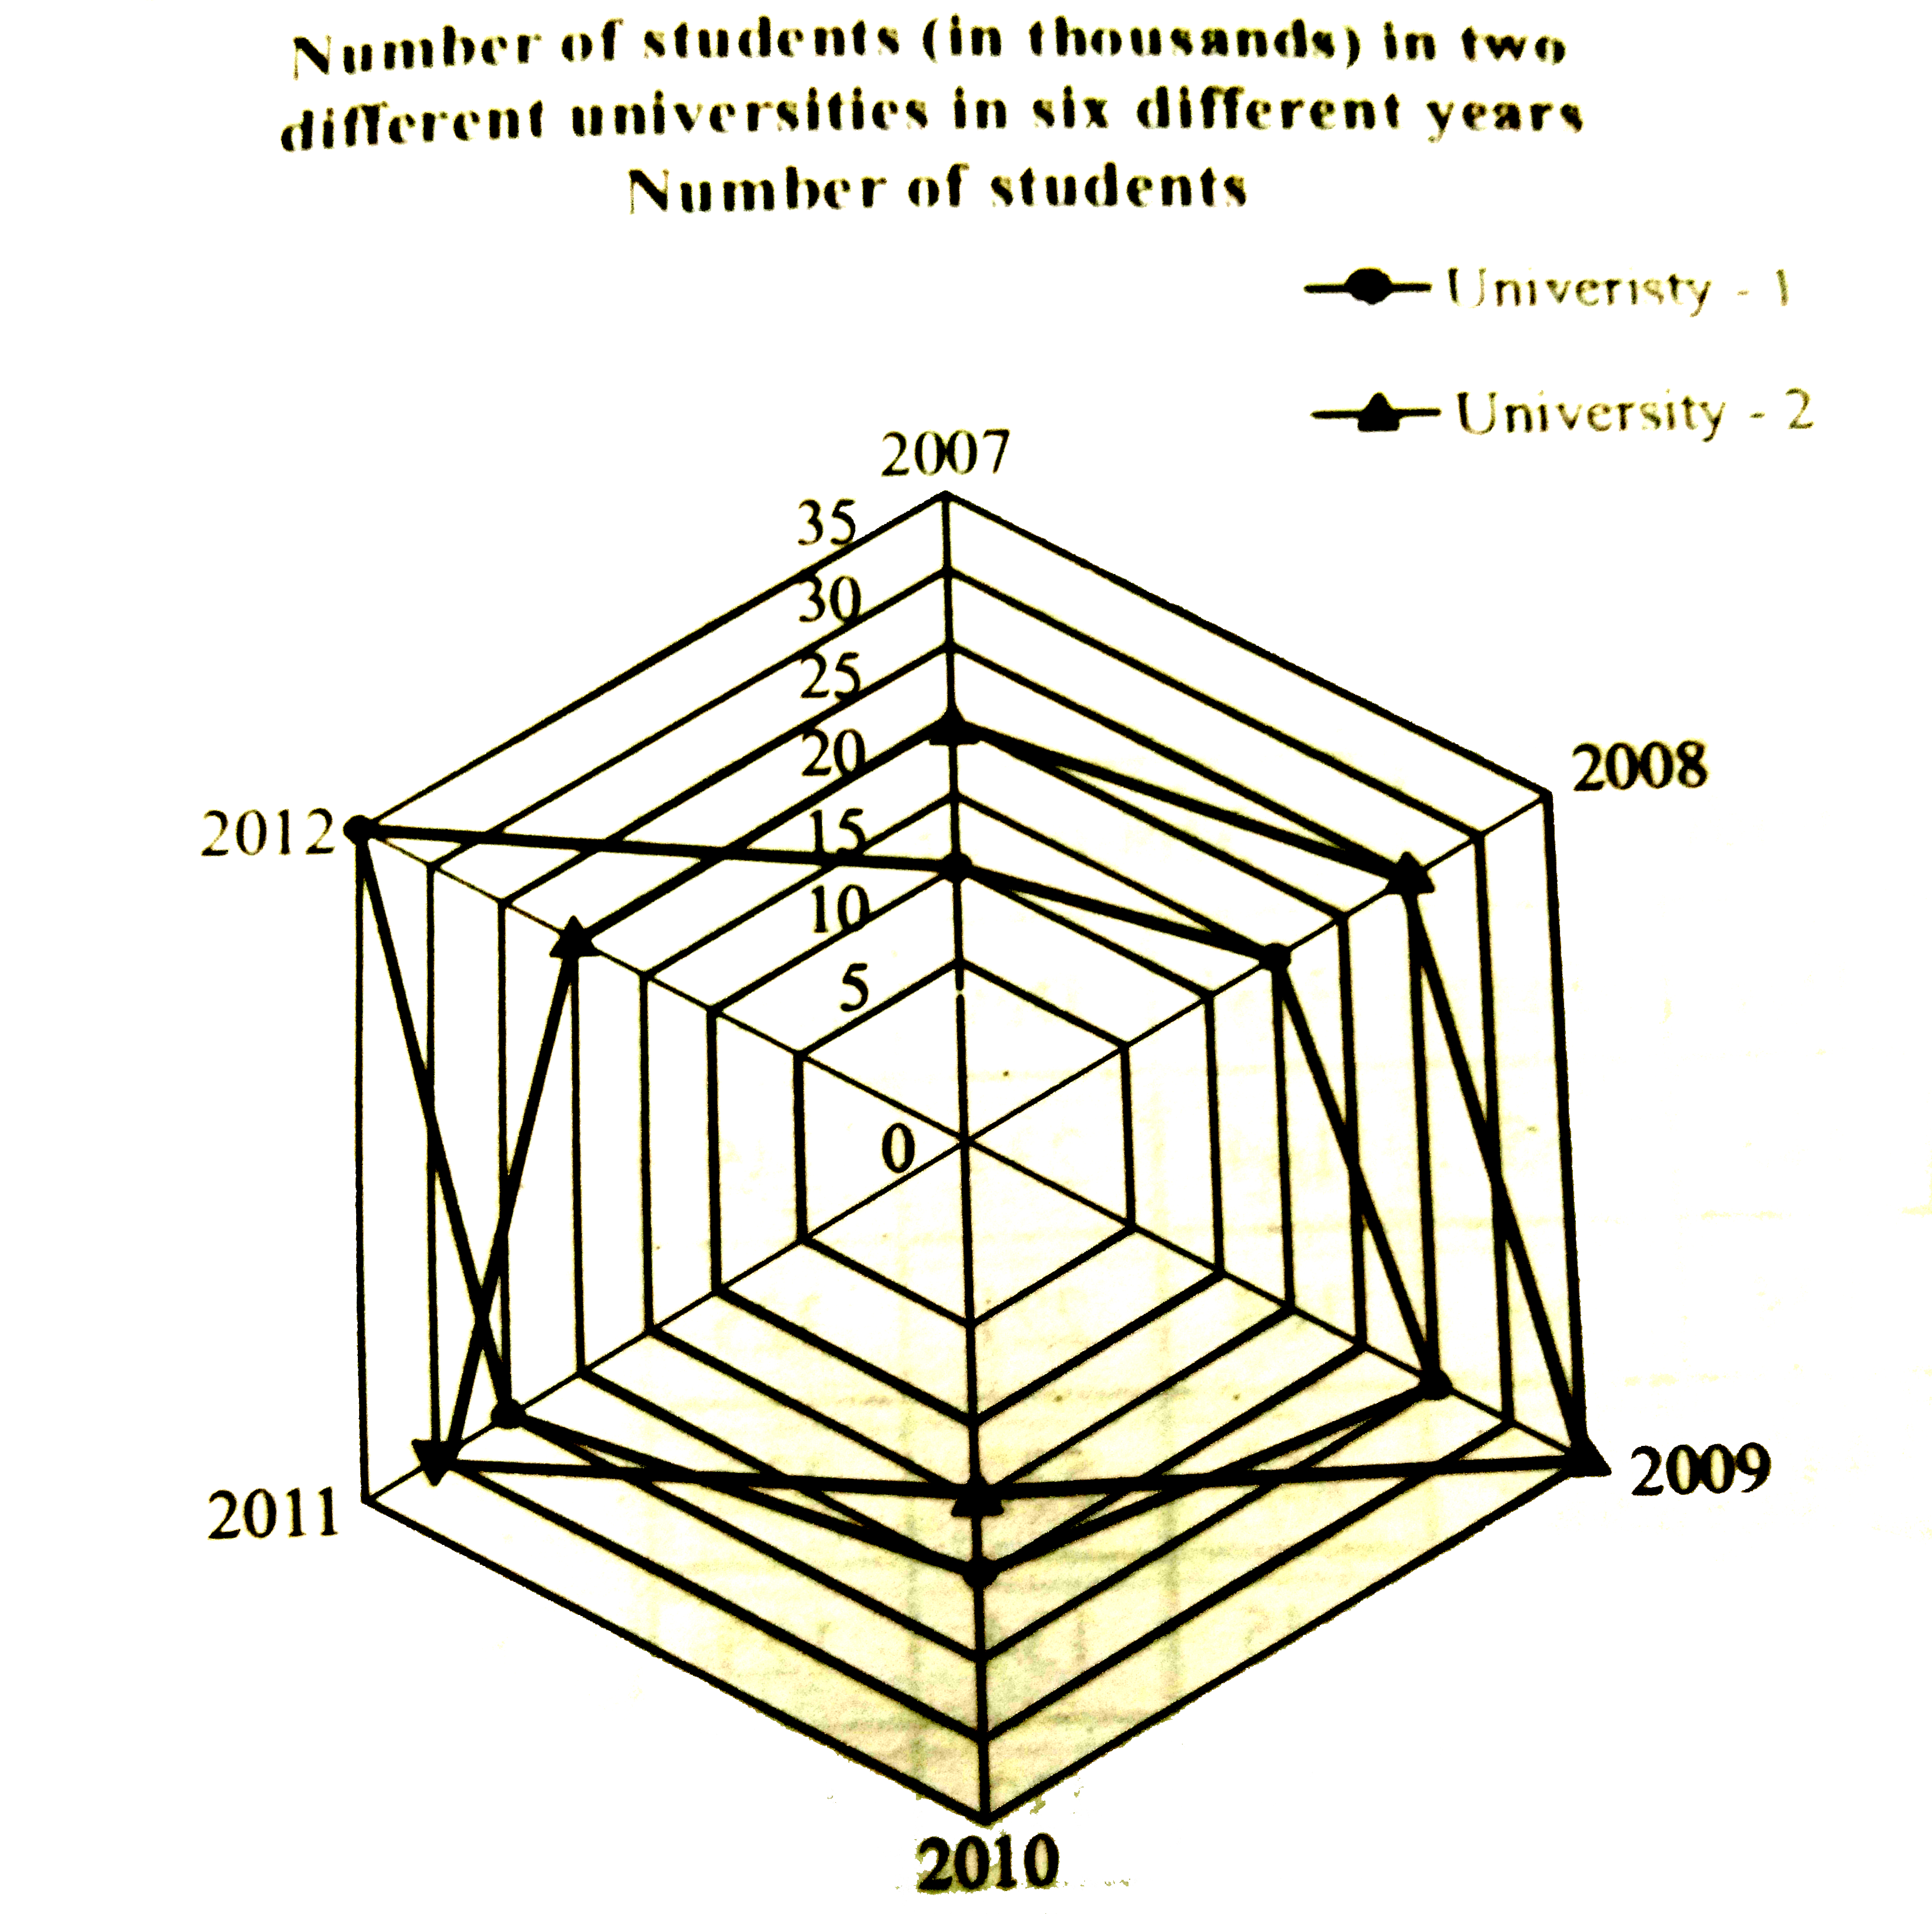
In which year was the difference between the number of students in university -I and the numer of students in university-2 highest?
View SolutionIn the given histogram, in which class notes the median height of the students lie
View Solution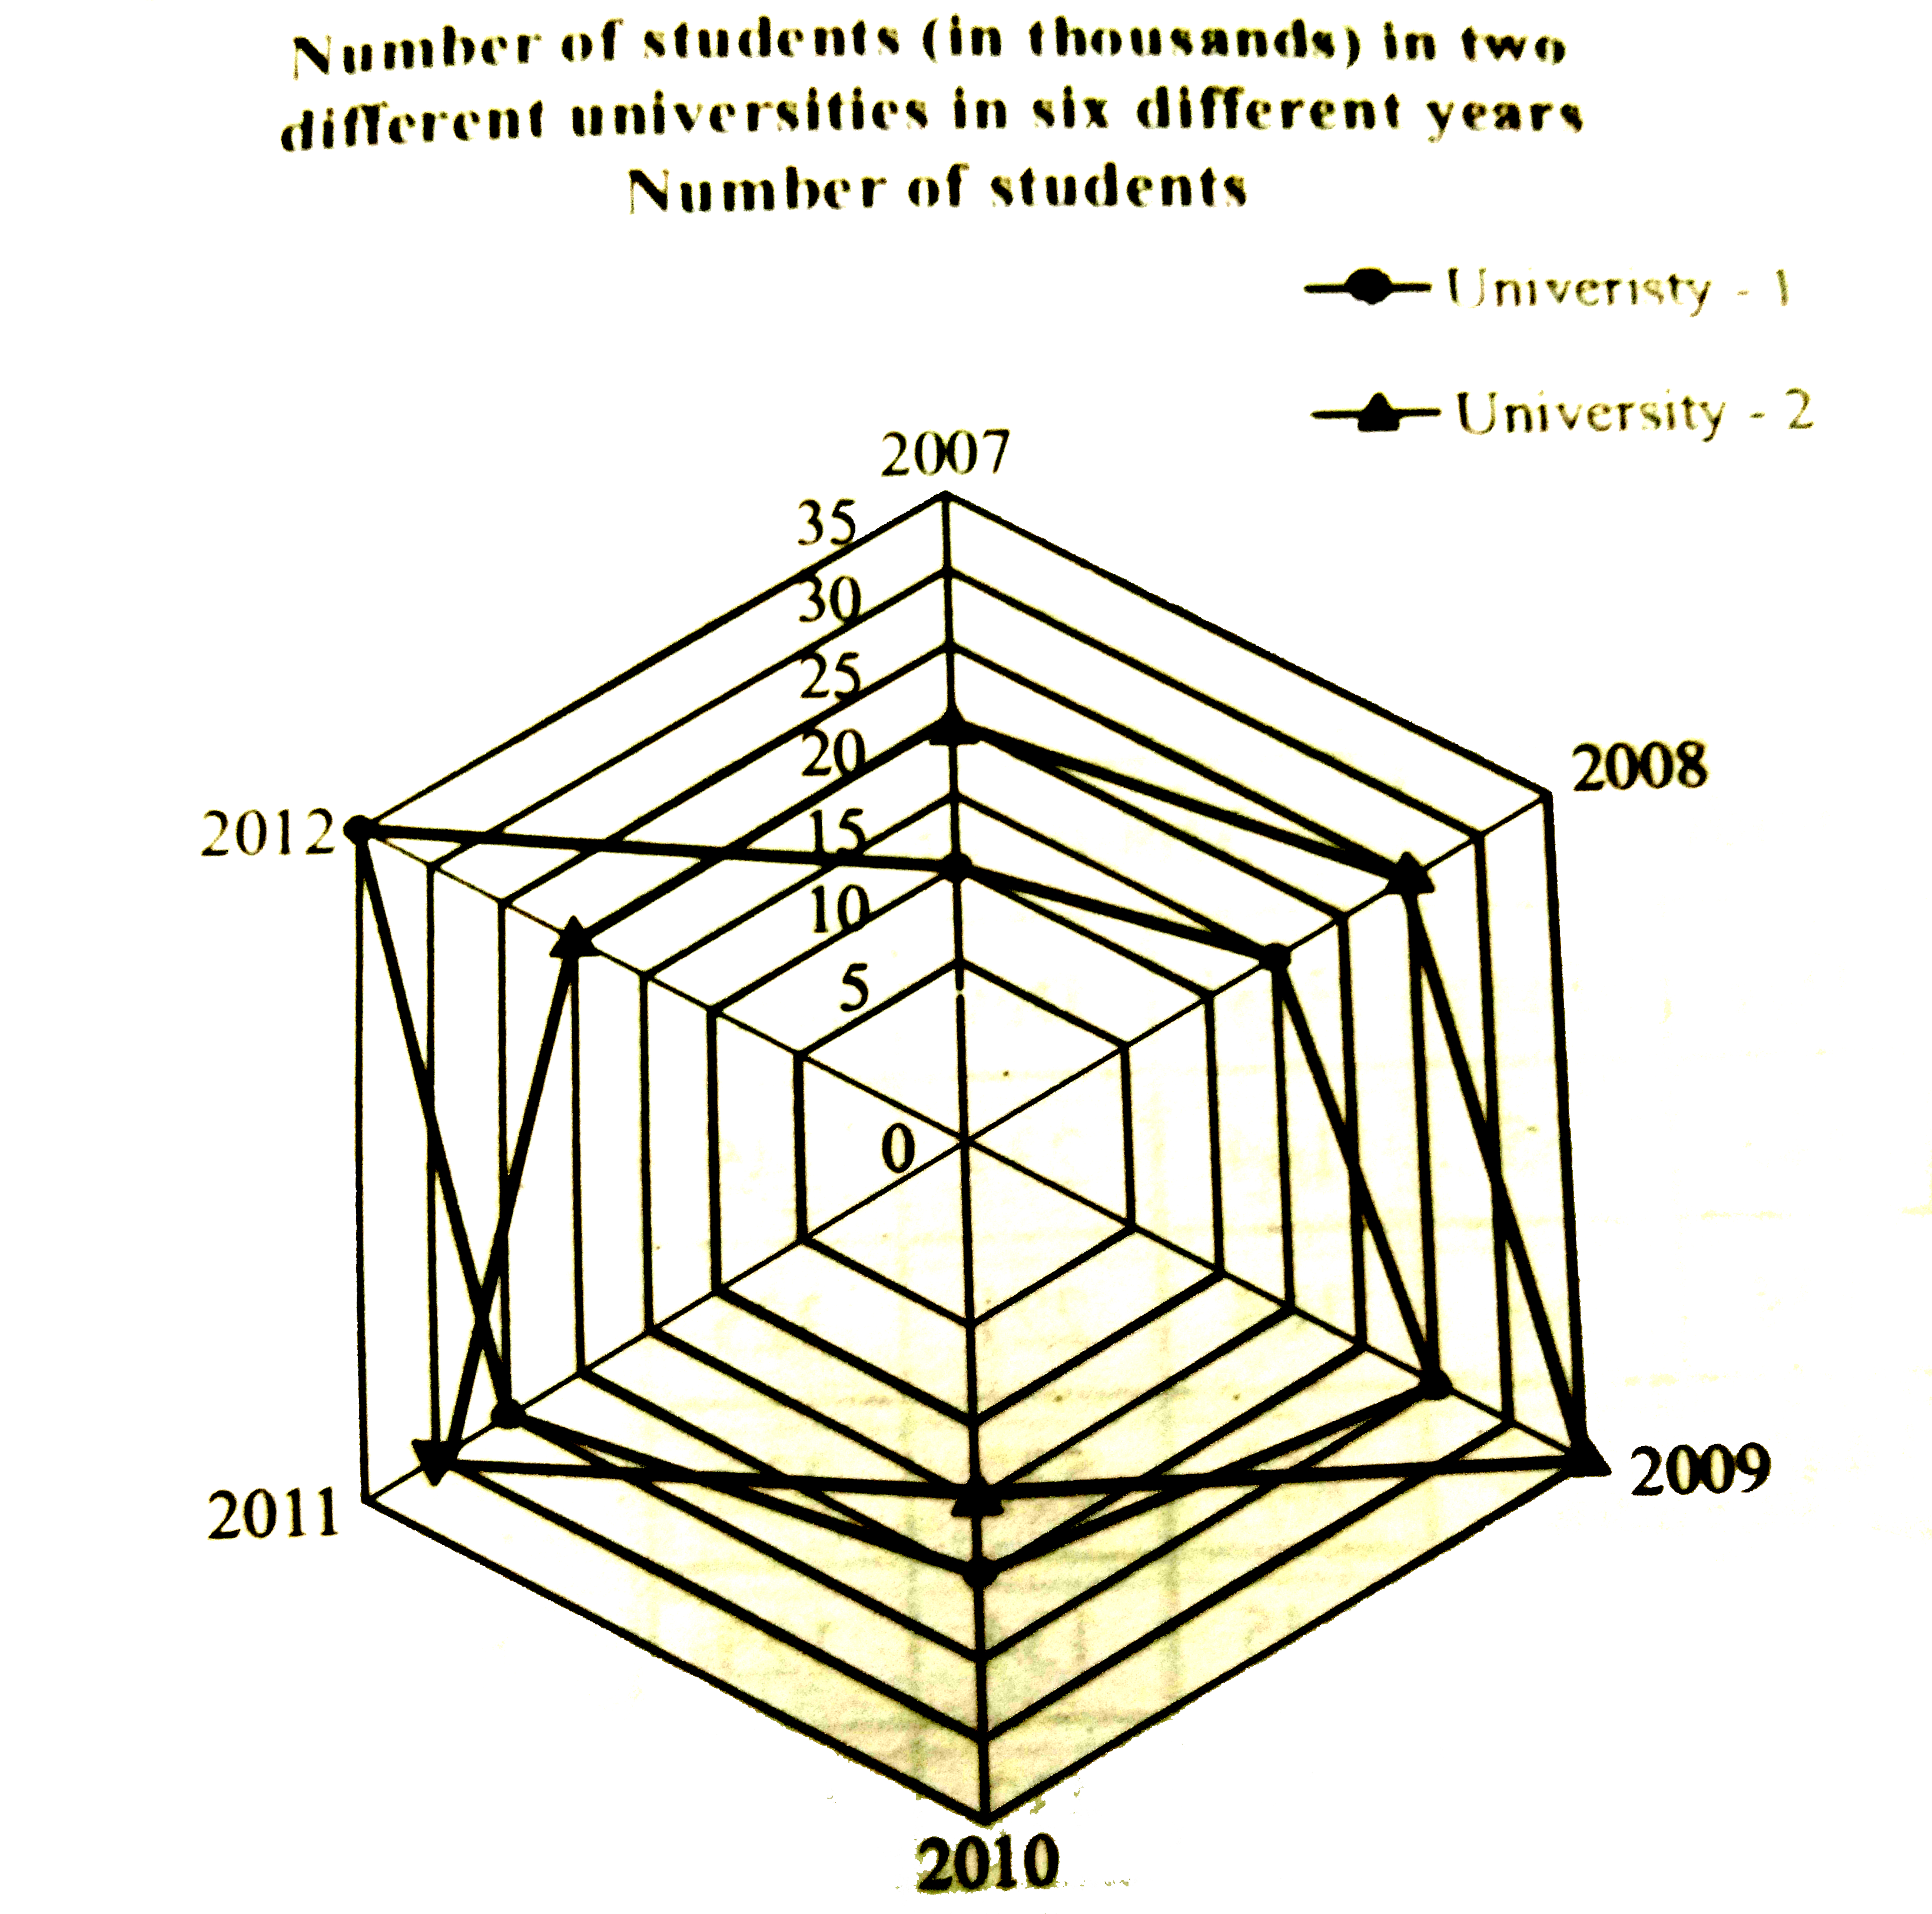
What was the difference between the number of students in university-1 in the year 2010 and the number of students in university-2 in the year 2012 ?
View SolutionThe given histogram shows the height of the students:
दिए गए हिस्टोग्राम छात्रों की लम्बाई को दर्शाता है
The number of students whose height is in the class interval 165-170 is what percentage less than the number of students whose height is in the interval 150-155?
कक्षा अंतराल 165-170 में जिन छात्रों की लम्बाई है, उन छात्रों की संख्या प्रतिशत में कितना कम है लम्बाई अंतराल 150-155 से ज्ञात करे |
View Solution
