The bar chart given below shows the number of mobile phone thefts in 2 cities Delhi and Jaipur from month February 2015 to June 2015.
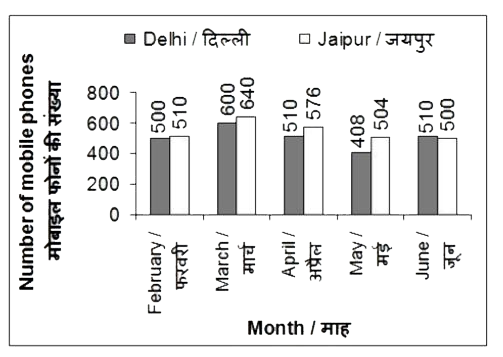
What was the average number of mobile phones thefts in Jaipur from February 2015 to June 2015?
550
576
408
546
The correct Answer is:D
Step by step video & image solution for The bar chart given below shows the number of mobile phone thefts in 2 cities Delhi and Jaipur from month February 2015 to June 2015. What was the average number of mobile phones thefts in Jaipur from February 2015 to June 2015? by Maths experts to help you in doubts & scoring excellent marks in Class 14 exams.
Similar Questions
The bar chart given below shows the number of mobile phone thefts in 2 cities Delhi and Jaipur from month February 2015 to June 2015.
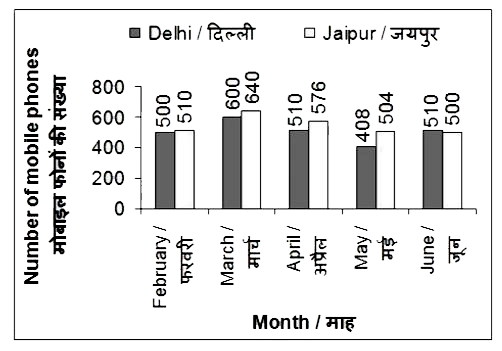
What is the percentage change in the number of mobile phones thefts in Jaipur from February 2015 to April 2015?View SolutionThe bar chart given below shows the number of mobile phone thefts in 2 cities Delhi and Jaipur from month February 2015 to June 2015.
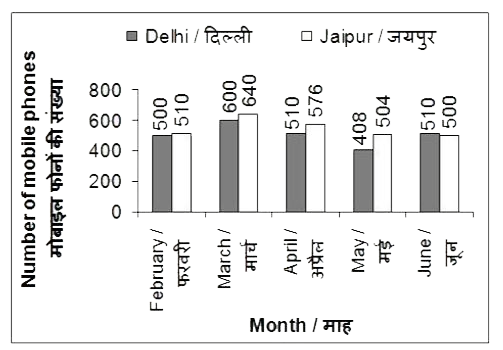
In Delhi, what was the percentage change in the number of mobile phones theft from April 2015 to May 2015?View Solution
Knowledge Check
- Question 1 - Select One or More
The table given below shows the number of customers (in thousand) visiting 2 shopping complexes A and B from january 2017 to June 2017.
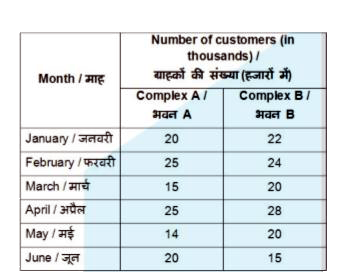
What is the average number of customers (in thousands) in complex B from February to May?Aa. 22Bb. 24Cc. 23Dd. 25 - Question 2 - Select One
The table given below shows the number of students admitted in 2 sections X and Y from year 2011 to 2015.
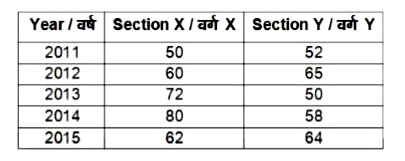
What is the percentage change in the number of students admitted in section X from year 2011 to 2013?A22B50C44D72 - Question 3 - Select One or More
The table given below shows the number of students admitted in 2 sections X and Y from year 2011 to 2015.
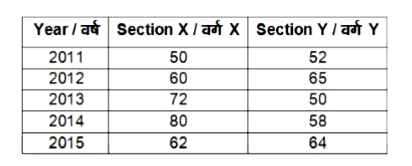
What is the percentage change in the number of students admitted in section Y from year 2011 to 2014?A13.81B11.54C6D58
The bar chart given below shows the number of mobile phone thefts in 2 cities Delhi and Jaipur from month February 2015 to June 2015.
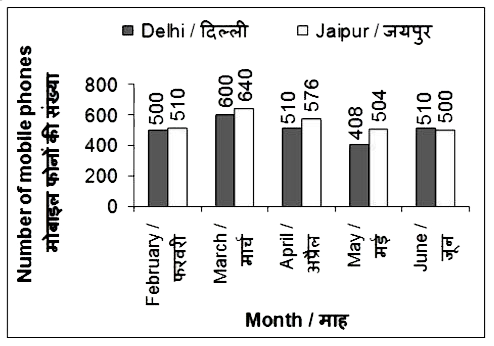
For how many months, was the number of mobile phones thefts in Jaipur higher than that in Delhi?View SolutionThe bar chart given below shows the sales (in crores) of 2 companies A and B from years 2010 to 2015.
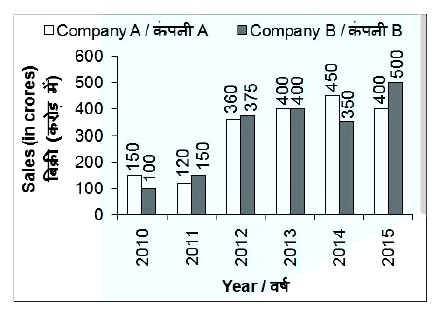
What is the average sale (in crores) of company A from years 2010 to 2015?View SolutionThe line chart given below shows the number of students in 2 sections X and Y from year 2009 to 2016.
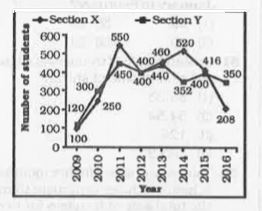
What is the percentage change in the number of students in section Y from year 2011 to year 2015?View SolutionThe line chart given below shows the number of students who have taken admission in college A and B from the years 2010 to 2015 .
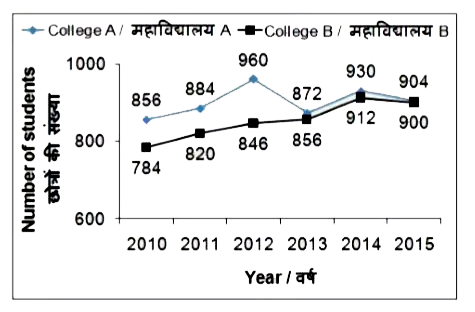
What is the average difference of number of students in college A and B in the given period?View SolutionThe bar chart given below shows the revenue (in crores) of company A for the years 2008 to 2015.
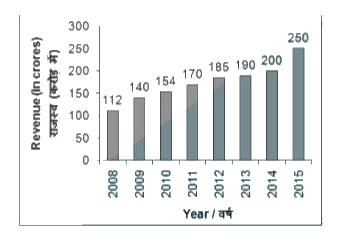
What is the average revenue (in crore Rs) per year from 2011 to 2015?View Solution

