Study the following pie-chart and answer the given question.
The pie-chait shows Budget Expenditure of a company in the year 2015 (percentage distribution) on different heads A. B.C.D&E.
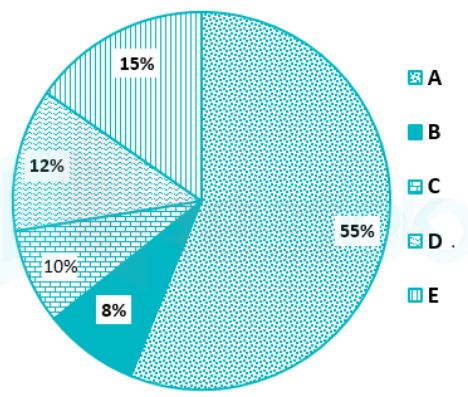
If Rs 165 crore were spent in year 2018 on A, what would have been the total expenditure for that year (in 3 crores)?
Rs 300
Rs 400
Rs 320
Rs 350
The correct Answer is:A
Step by step video & image solution for Study the following pie-chart and answer the given question. The pie-chait shows Budget Expenditure of a company in the year 2015 (percentage distribution) on different heads A. B.C.D&E. If Rs 165 crore were spent in year 2018 on A, what would have been the total expenditure for that year (in 3 crores)? by Maths experts to help you in doubts & scoring excellent marks in Class 14 exams.
Updated on:21/07/2023Similar Questions
Study the following pie-chart and answer the given questions. The pie chart shows the Budget Expenditure of a company in the year 2018 (percentage distribution) on different heads A, B, C, D and E. If ₹165 crore were spent in the year 2018 on A, what would have been the total expenditure for that year (in ₹ crores)?
निम्नलिखित पाई-चार्ट का अध्ययन करें और दिए गए प्रश्नों के उत्तर दें
पाई चार्ट वर्ष 2018 में एक कंपनी के बजट व्यय को अलग-अलग प्रमुखों A, B, C, D और E पर दिखाया गया है।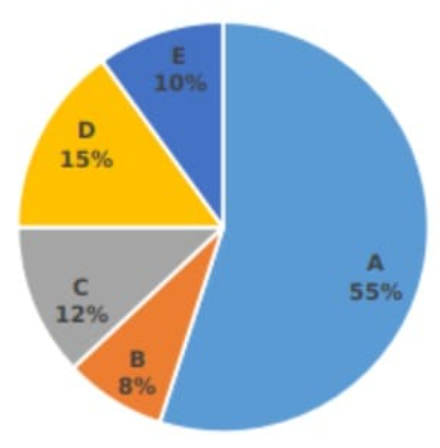
यदि A पर वर्ष 2018 में ₹165 करोड़ खर्च किए गए थे, तो उस वर्ष (₹ करोड़ों में) कुल खर्च क्या रहा होगा?
View SolutionStudy the following pie-chart and answer the given question.
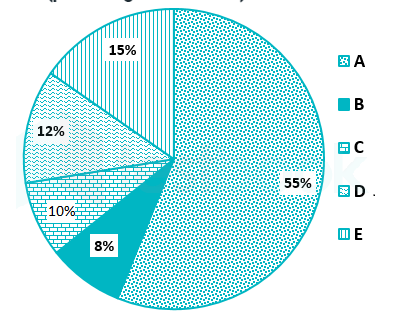
The pie-chart shows the Budget Expenditure of a company in the year 2018 (percentage distribution) on different heads AB.C,D & E.
The central angle of the sector representing expenditure on head E is:
View Solution
Knowledge Check
Study the following pie chart and answer the question that follows
The pie chart shows company XYZ expenditure on various heads for Q3 2015.
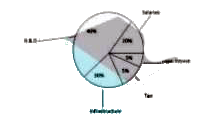
If the company the spent a total of Rs 120 lakhs crores on the various heads, then how much was spent on loan interestARs 12BRs 48CRs 24DRs 6Study the pie chart and answer the given questions.
The total expenditure of a company for a particular month is Rs. 60000. The various heads of expenditure I to IV are indicated in a pie chart given below. These heads are :
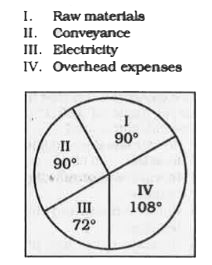
What percentage of total expenditure is an electricity?A23%B25%C30%D20%Study the pie chart and answer the given questions.
The total expenditure of a company for a particular month is Rs. 60000. The various heads of expenditure I to IV are indicated in a pie chart given below. These heads are :
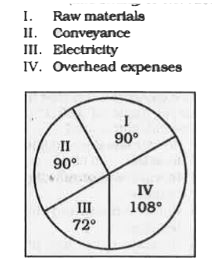
What percentage of total expenditure is on raw materials?A25%B30%C60%D23%
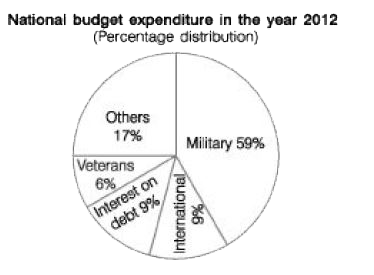
If 9 billion were spent in year 2012 for veterans, then what would have been the total expenditure for that year (in billions)?
View SolutionStudy the following graph carefully to answer the questions given below. Expenditure in lakhs) of three different Companies in Five Different Years
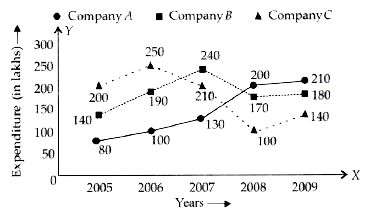
Total expenditure of all the three companies together in the year 2006 was what Percentage of the total expenditure of Company A over all the years together?
View SolutionStudy the following graph carefully to answer the questions given below. Expenditure in lakhs) of three different Companies in Five Different Years
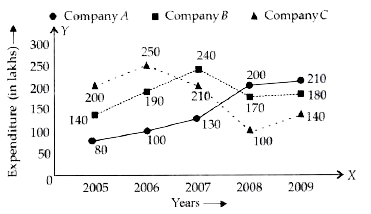
What was the difference between the total expenditure of Company B in the year 2006 and 2008 together and the total expenditure of Company C in the year 2007 and 2009 together?
View SolutionStudy the pie chart and answer the given questions.
The total expenditure of a company for a particular month is Rs. 60000. The various heads of expenditure I to IV are indicated in a pie chart given below. These heads are :
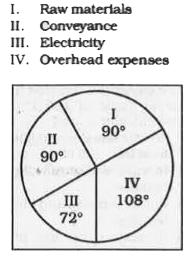
Total expenditure on conveyance is :
View SolutionThe pie chart shows the breakup of expenditure of a mining company for the year 2017. Study the diagram and answer the following questions.
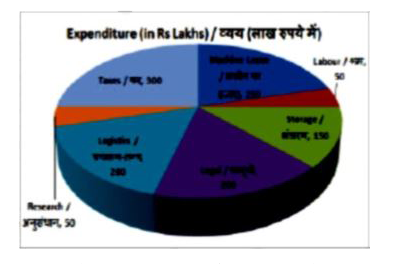
Expenditure on Labour and Research constitute what percent of total expenditure?
View Solution
