Study the below table and answer the question.
The number of students enrolled for a Vocational Course (VC) in Institutes A, B, C, D and E during 6 years:

The total number of students enrolled in VC in Institutes C,D and E in 2017 exceeds the total number of students enrolled in Institute B in 2015, 2017 and 2019 by x, where x lines between :
60 and 70
70 and 80
40 and 50
50 and 60
The correct Answer is:A
Step by step video, text & image solution for Study the below table and answer the question. The number of students enrolled for a Vocational Course (VC) in Institutes A, B, C, D and E during 6 years: The total number of students enrolled in VC in Institutes C,D and E in 2017 exceeds the total number of students enrolled in Institute B in 2015, 2017 and 2019 by x, where x lines between : by Maths experts to help you in doubts & scoring excellent marks in Class 14 exams.
Topper's Solved these Questions
- BOOK - SSC SELECTION POSTCHAPTER - SSC SELECTION POST 9 NOV 2020 SHIFT 2 GRADUATION LEVELEXERCISE - SECTION : QUANTITATIVE APTITUDE25videos
SSC SELECTION POST 9 NOV 2020 SHIFT 2 GRADUATION LEVEL
- BOOK - SSC SELECTION POSTCHAPTER - SSC SELECTION POST 9 NOVEMBER 2020 SHIFT 3 MATRICULATION LEVELEXERCISE - Quantitative Aptitude25videos
SSC SELECTION POST 9 NOVEMBER 2020 SHIFT 3 MATRICULATION LEVEL
Similar Questions
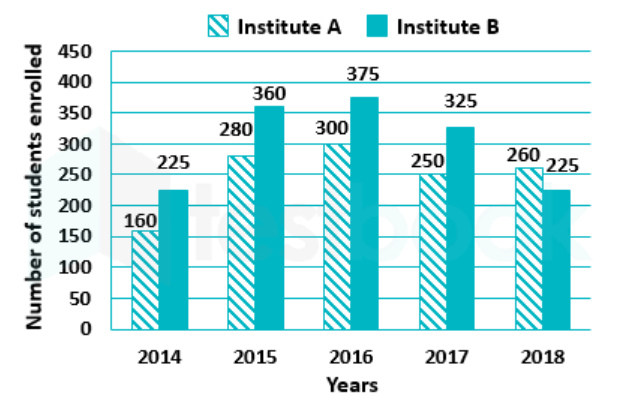
In the given bar graph, the number of students enrolled in institute b in the year 2016 is what percentage of students enrolled in institute A in 2016?
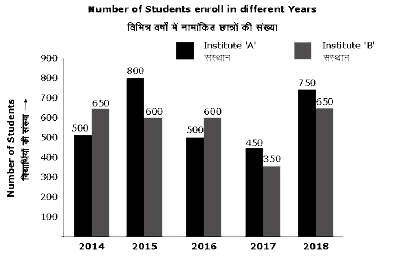 View Solution
What is the ratio of number of students passed from institute F in 2003 to the number of students passed from institute B in 2005View Solution
Knowledge Check
- Question 1 - Select One
Study the below table and answer the question.
The number of students enrolled for a Vocational Course (VC) in Institutes A, B, C, D and E during 6 years:

The total number of students enrolled in VC in Institute A in 2014, 2016 and 2017 is what percentage of the total number of students enrolled in VC in all the five institutes in 2019?A30%B45%C40%D35% - Question 2 - Select One
Study the below table and answer the question. The number of students enrolled for a Vocational Course (VC) in Institutes A, B, C, D and E during 6 years

The average number of students enrolled in VC in Institute C in six years is what percentage more than the number of students enrolled in Institute E in 2015 (correct to one decimal place)?A3.6%B4.6%C4.2%D3.9% - Question 3 - Select One
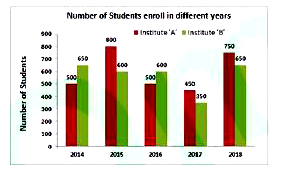
In the given bar graph, the number of students enrolled in institute B in the year 2016 is what percentage of students enrolled in institute A in 2016?A1.2B2503%C85%D3256%

What is the total number of students passed from all institutes together in the year 2006View SolutionThe given bar graph presents the number of students enrolled for a vocational course in institutes A and B during a period of five years.
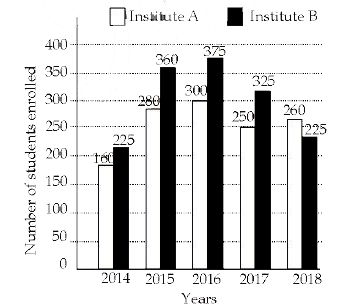
percentage the number of students enrolled in B more than the number of students enrolled in A during 2017?View SolutionThe given Bar Graph presents the number of students enrolled for a vocational course in institutes A and B during a period of five years.
दिया गया दंड आरेख A और B संस्थानों में पांच वर्षों की अवधि के दौरान व्यावसायिक पाठ्यक्रमों नामांकन लेने वाले छात्रों की संख्या को दर्शाता है |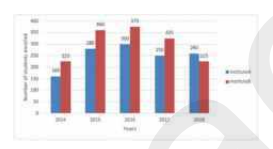 The total number of students enrolled in A during 2014, 2016 and 2018 is what percentage (correct to one decimal place) of the total number of students enrolled in B during the five years?
2014, 2016 और 2018 में A में नामांकन लेने वाले छात्रों की कुल संख्या इन पांच वर्षों के दौरान B में नामांकन लेने वाले छात्रों की कुल संख्या का कितना प्रतिशत ( एक दशमलव स्थान तक सही ) है ?View SolutionWhat is the ratio of the total numbers of students enrolled in A during 2015 and 2018 to that of students enrolled in B during 2014 and 2016.
 View Solution
In which year the number of students enrolled in B is x6more , where 25<x<30 then the number of students enrolled in A in the same year?
View Solution

