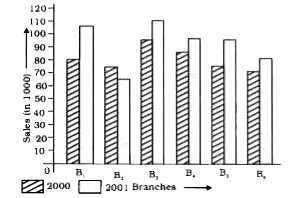
Study the following bar graph and answer the question that follows.
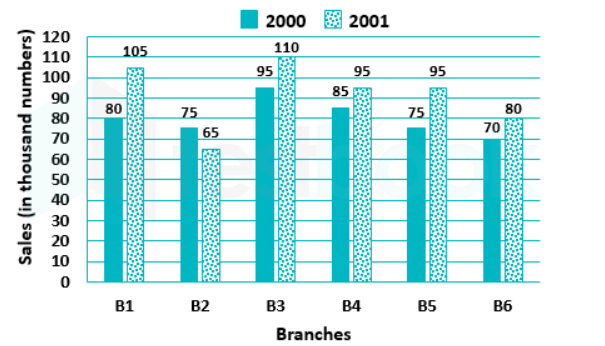
The total sales of books for branches Bl to B5 for the year 2000 is how much more than that of the average sales of books for branches Bl to B5 for the year 2001?
470
504
410
316
The correct Answer is:4
Step by step video & image solution for Study the following bar graph and answer the question that follows. The total sales of books for branches Bl to B5 for the year 2000 is how much more than that of the average sales of books for branches Bl to B5 for the year 2001? by Maths experts to help you in doubts & scoring excellent marks in Class 14 exams.
Updated on:21/07/2023Topper's Solved these Questions
- SSC SELECTION POST 10 NOV 2020 SHIFT 3 GRADUATION POST BOOK - SSC SELECTION POSTCHAPTER - SSC SELECTION POST 10 NOV 2020 SHIFT 3 GRADUATION POST EXERCISE - Quantitative Aptitude
25 Videos
- SSC SELECTION POST 9 NOV 2020 SHIFT 2 GRADUATION LEVELBOOK - SSC SELECTION POSTCHAPTER - SSC SELECTION POST 9 NOV 2020 SHIFT 2 GRADUATION LEVELEXERCISE - SECTION : QUANTITATIVE APTITUDE
25 Videos
Similar Questions
Study the following bar graph and answer the question that follows.
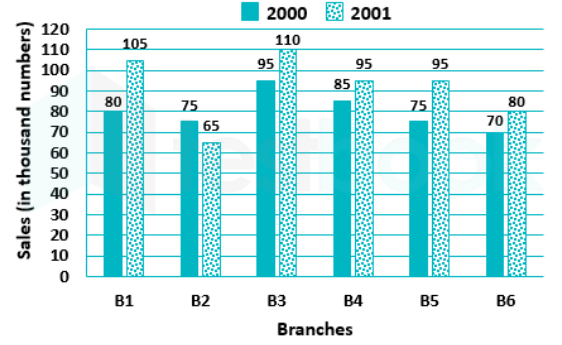
The ratio of the total sales of books for branches B2, B4 and B5 taken together for the year 2000 to the total sales of books for branches B1, B3 and B6 taken together for the year 2001 is:
View SolutionStudy the graph and answer the questions.
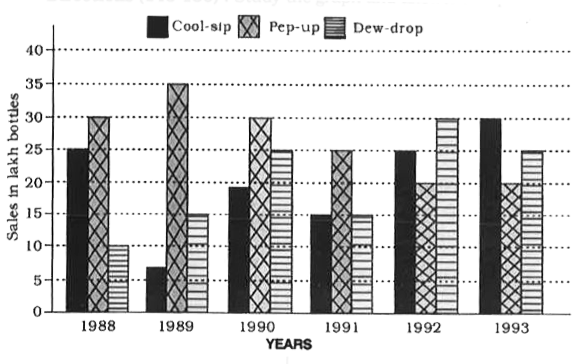
In which year the sale of coolsip is minimum?
View Solution
Knowledge Check
Study the following bar graph and answer the question that follows.
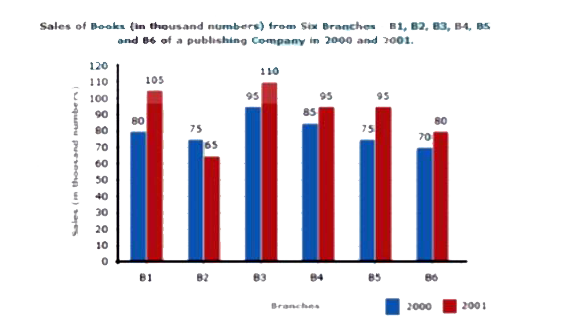
The ratio of the total sales of books for all branches taken together for the year 2000 to that of 2001is:
(a)55:48
(b)55:37
(c)37:55
(d)48:55A55:48B55:37C37:55D48:55The given bar graph present the sales of the number of books by six branches of a publishing company during two consecutive years 2000 and 2001.
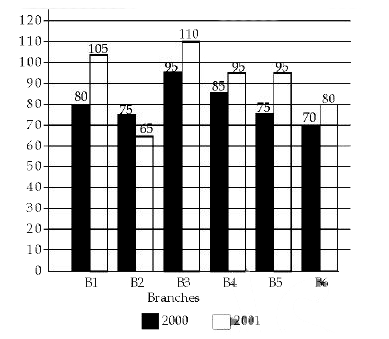
The average of total sales by all branches for both the years is:A171.37B171.57C171.27D171.67Study the graph and answer the questions.
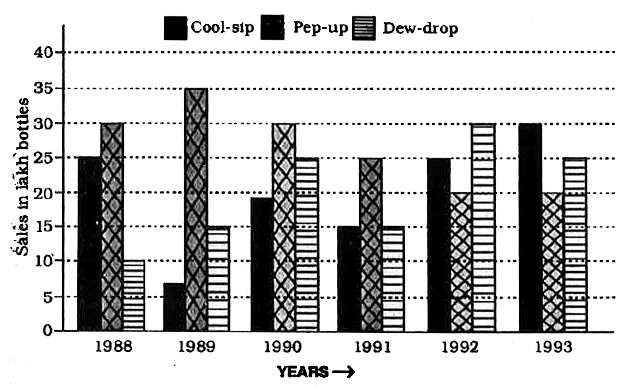
In which year the sale of cool-sip is minimum ?A1990B1992C1993DNone of the above
Study the following graph and answer the question based on the graph.
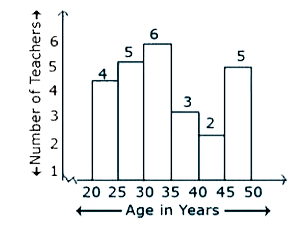
How many teachers are aged 45 years or more but less than 50 years?
View SolutionStudy the graph and answer the questions.
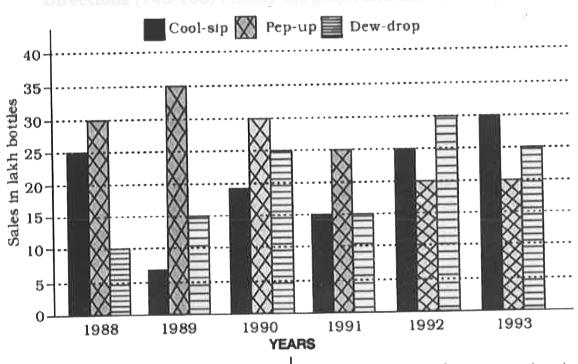
In which year sale of Dew -drop is maximum ?
View SolutionTable shows the sales of books from six branches of a publishing company during 2000 and 2001

What is the total sales of books from branches B1,B3, B6 together for both the years
View SolutionBar-chart showing the Sales of Books (in 1000) from six-branches B1,B2,B3,B4,B5andB6 of a Publishing Company in 2000 and 2001 is given below. Study the chart and answer the questions.
Total sales of branches B6 for both the years is what percent of the total sales of branches B3 for both the years?
View SolutionStudy the graph and answer the questions.
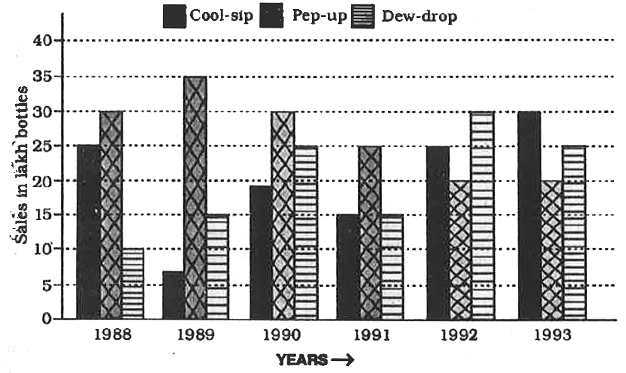
In which year sale of Drew-drop is maximum ?
View Solution
