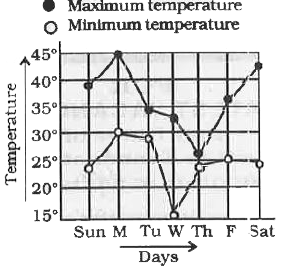
The following graph represents the maximum and minimum temperature recorded every day in a certain week. The day on which the difference between the maximum and minimum temperature was maximum is

Wednesday
Saturday
Sunday
Monday
The correct Answer is:B
Step by step video, text & image solution for The following graph represents the maximum and minimum temperature recorded every day in a certain week. The day on which the difference between the maximum and minimum temperature was maximum is by Maths experts to help you in doubts & scoring excellent marks in Class 14 exams.
Updated on:21/07/2023Topper's Solved these Questions
- DATA HANDLING AND PATTERNSBOOK - ARIHANT PUBLICATION PUNJABCHAPTER - DATA HANDLING AND PATTERNSEXERCISE - Chapter Exercise
50 Videos
- DATA HANDLING BOOK - ARIHANT PUBLICATION PUNJABCHAPTER - DATA HANDLING EXERCISE - CHAPTER EXERCISE
50 Videos
- ERROR ANALYSISBOOK - ARIHANT PUBLICATION PUNJABCHAPTER - ERROR ANALYSISEXERCISE - CHAPTER EXERCISE
25 Videos
Similar Questions
Knowledge Check
The difference between the maximum and minimum observation is called
AfrequencyBclass sizeCrangeDmeanDifference between maximum and minimum values is -
ARangeBArithmetic meanCMean deviationDStandard deviationThe difference between the maximum and the minimum observations in the data is
Aclass intervalBfrequencyCcumulative frequencyDrange
The maximum and minimum temperature displayed daily in the weather bulletin refer to the –
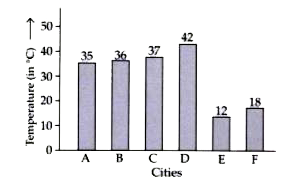
View SolutionThe bar graph shows the temperatures in 6 cities.

The difference between the maximum and the minimum temperature is ______ .
View Solution
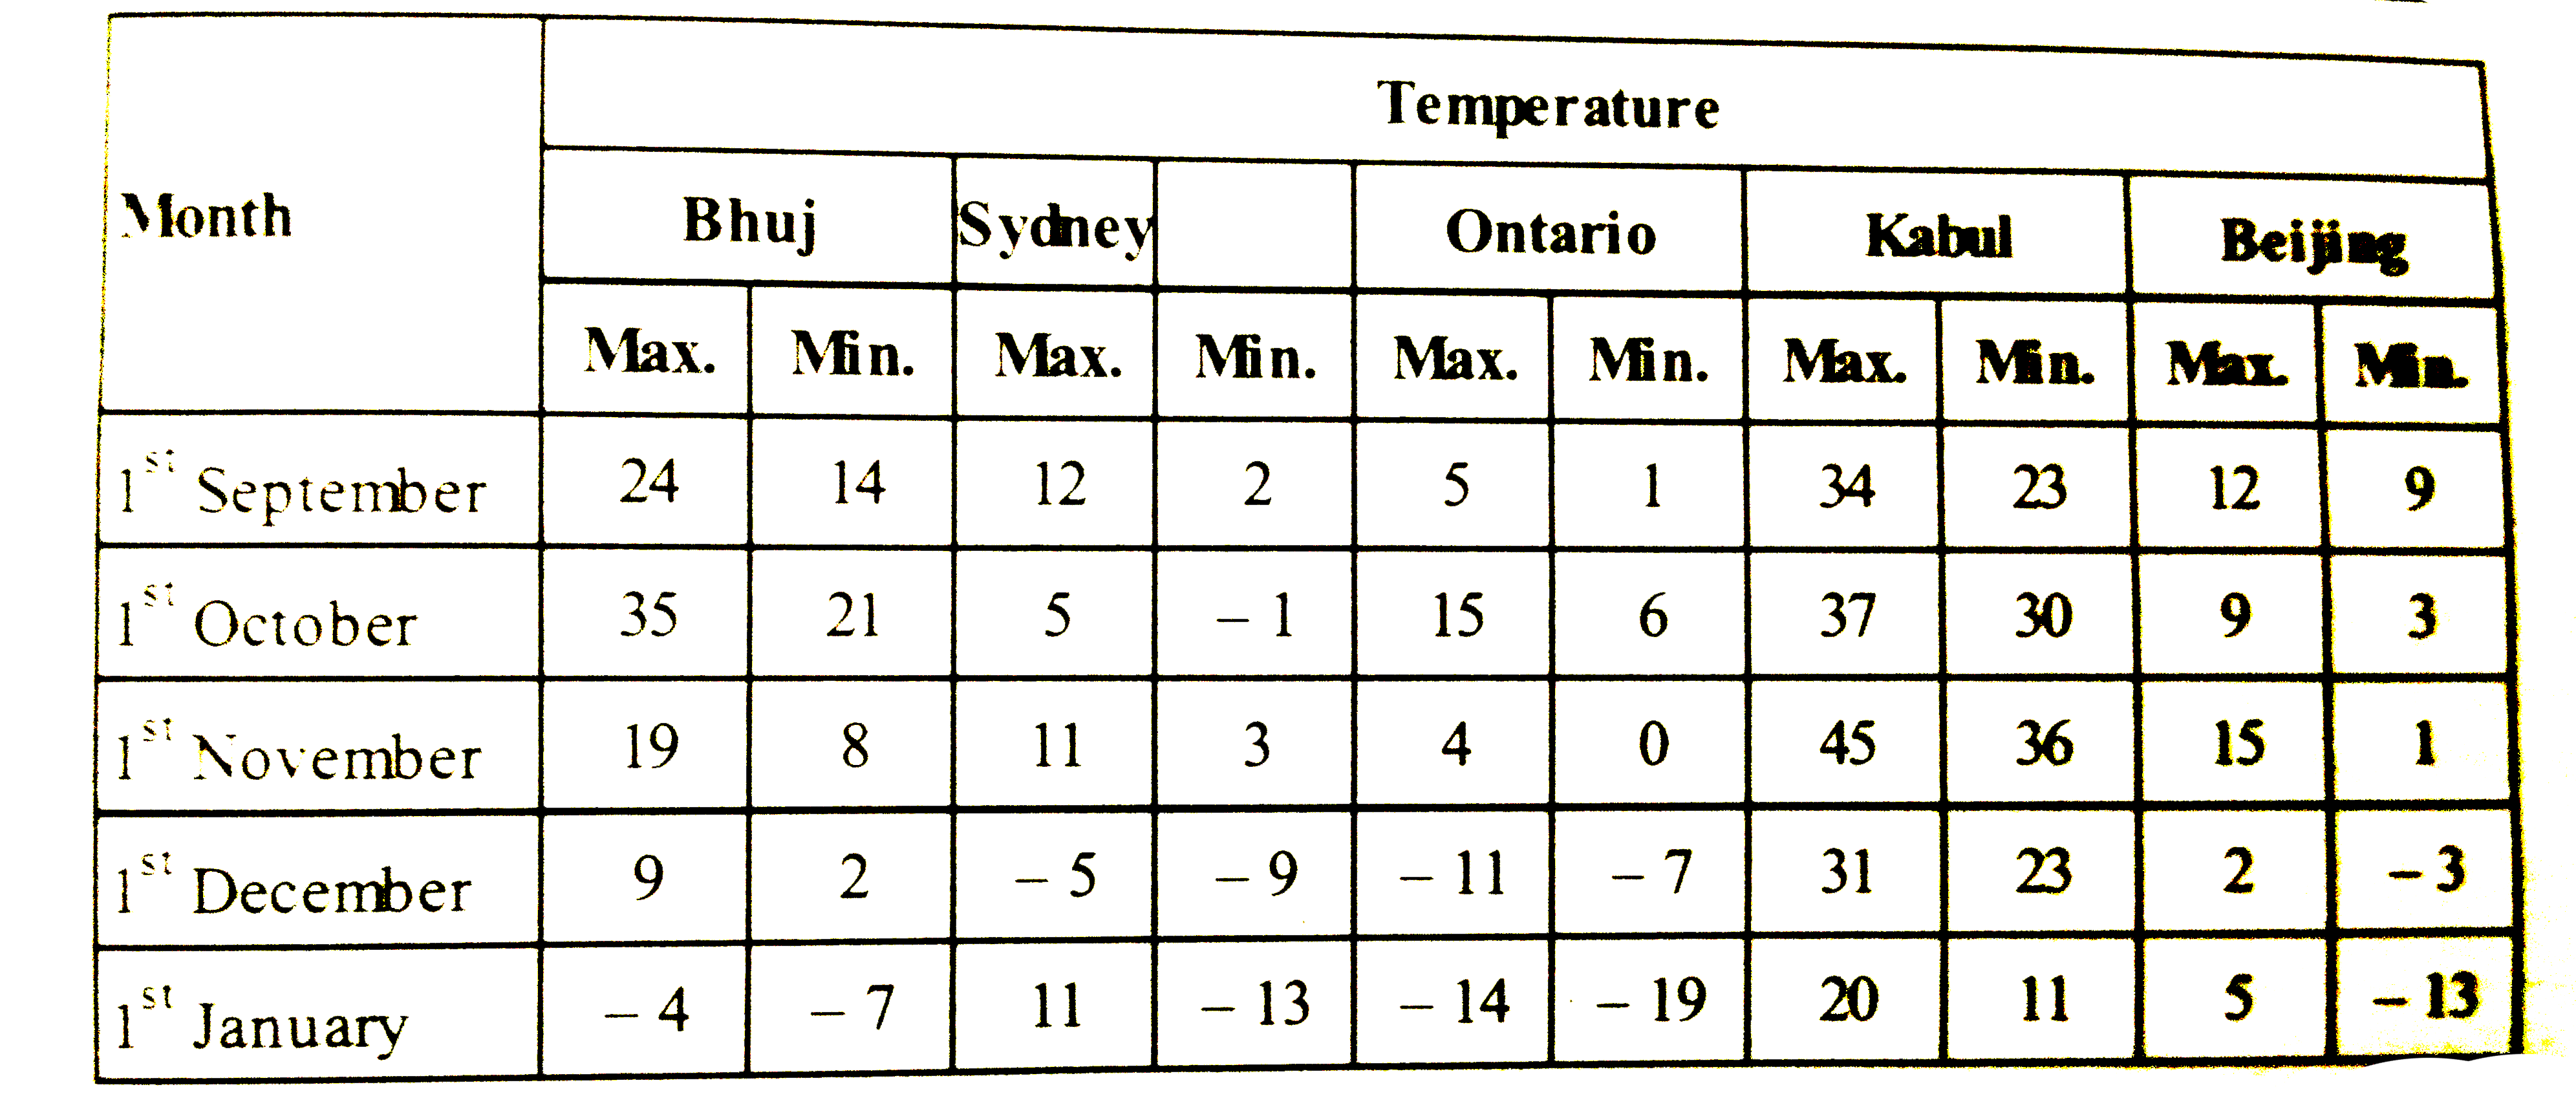
In which months (on 1st day) is the difference beween maximum temperature and minimum temperature Bhuj second highest ?
View SolutionThe difference between the maximum and minimum temperatures recorded for a place during a period of one day is called
View SolutionMaximum temperature of the day occurs generally
View Solution
