Study the following graph carefully to answer the questions.
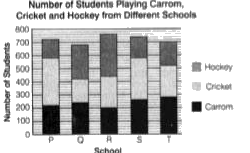
If the number of students playing each game in school S in increased by and the number of students playing each game in school Q is decreased by then what will be the difference between number of students in school S and Q?
The correct Answer is:D
Step by step video, text & image solution for Study the following graph carefully to answer the questions. If the number of students playing each game in school S in increased by 15% and the number of students playing each game in school Q is decreased by 5% then what will be the difference between number of students in school S and Q? by Maths experts to help you in doubts & scoring excellent marks in Class 14 exams.
Similar Questions
Study the bar graph and answer the following questions.
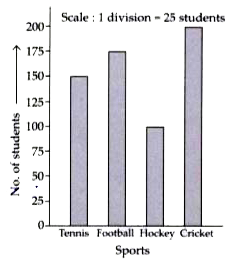
What is the difference between number of students playing football and hockey ?View SolutionStudy the following graph carefully to answer the questions.
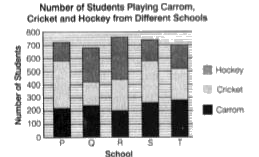
Total number of students playing Carrom and Hockey together from school P is what per cent of the total number of students playing these two games together from school R ?View Solution
Knowledge Check
- Question 1 - Select One
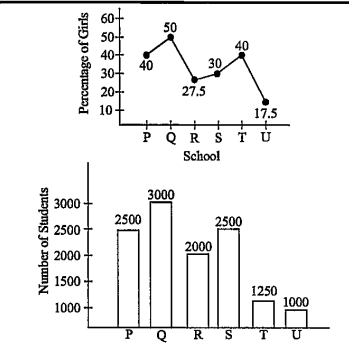
The average number of student in both School P and Q.A1425B1575C1450D2750 - Question 2 - Select One
Why students should play games in school ?
AIt makes them physically strongBIt makes work easier for teachersCIt helps in passing timeDIt develops co-operation and physical balance - Question 3 - Select One
Study the following graph carefully to answer the questions.
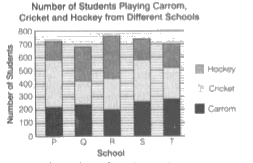
Total number of students playing Hockey from all schools together is approximately what per cent of the total number of students playing Cricket from all schools together ?A84%B74%C72%D79%
Study the following graph carefully and answer the questions that follow
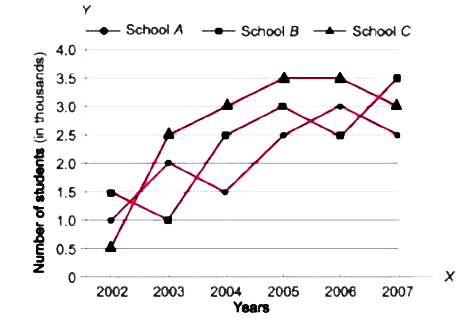
What was the average number of students in all schools together in the year 2006 ?View SolutionStudy the following graph carefully and answer the questions that follow
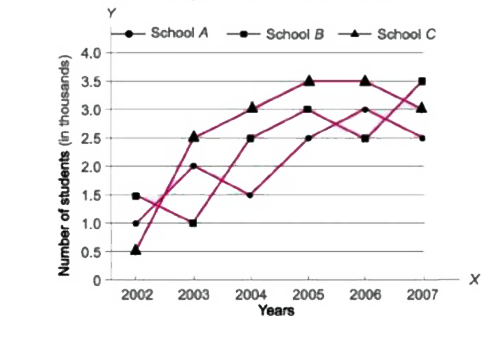
What was the difference between the total number of students in all schools together in the year 2003 and the number of students in school B in the year 2005 ?View SolutionStudy the following graph carefully and answer the questions that follow
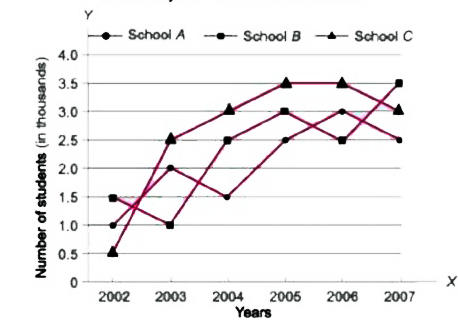
What was the approximate average number of students in school A over all the years together ?View SolutionRead the following table carefully and answer the questions given below.

If the number of students appeared from school C in each year is 4800, what is the average number of passed students from school C in all the years ?View SolutionStudy the following table and answer the questions.

Which school has the highest number of students scoring exactly 50% marks ?View Solution

