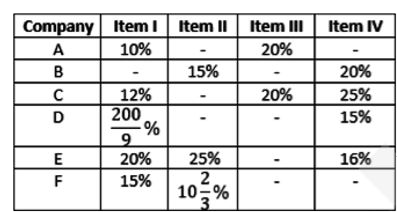
Given below is a table which tells us about the profit or loss% made on 4 items sold by 6 companies, A, B, C, D, E, and F.
Some of the data is missing in the table which one has to calculate using the given data.

The ratio of the selling price of item I and II for company A is 4 : 3. Find the profit or loss% made on item II if the ratio of their cost price was 8 : 9. It is known that company A made profit on item I.
A)12.25% profit
B)12.25% loss
C)1613% profit
D)2623% loss
Step by step video & image solution for Given below is a table which tells us about the profit or loss% made on 4 items sold by 6 companies, A, B, C, D, E, and F. Some of the data is missing in the table which one has to calculate using the given data. The ratio of the selling price of item I and II for company A is 4 : 3. Find the profit or loss% made on item II if the ratio of their cost price was 8 : 9. It is known that company A made profit on item I. by Maths experts to help you in doubts & scoring excellent marks in Class 14 exams.
Updated on:21/07/2023Similar Questions
The area of the shaded part in the figure given below is ______.

View SolutionThe inequation represented by the graph given below is :
View SolutionThe inequation that best describes the graph given below is _________
View SolutionThe inequation that best describes the following graph is _________
View SolutionWhich inequations represent the shaded region in the given figure
View SolutionMatch the items of column I with those of column II: ltimg src="https://d10lpgp6xz60nq.cloudfront.net/physics_images/NCERT_BIO_XI_C19_E01_011_S01.png" width="80%"gt
View SolutionMatch the items given in column A and B: ltimg src="https://d10lpgp6xz60nq.cloudfront.net/physics_images/NCERT_BIO_XII_C16_E01_004_Q01.png" width="80%"gt
View SolutionIdentify A,B,C and D,E
View Solution
