Study the following information carefully and answer the given questions:
In the year 2015, the salary expense of a company is 16 lakhs and the total number of employees is 80 and in the year 2016, the average salary of employees is Rs. 4000 more than the previous year. The salary expense in 2016 is 20% more than the previous year. Theother expense in the year 2016 is 34 lakhs. The total expense in the year 2015 and 2016 is same. In the year 2017, the number of employees is 5 less than the previous year. The average salary of employees in the year 2017 is Rs. 15000 and the other expense in the year 2017 is Rs. 47.75 lakhs.
Note: Salary expense = Average salary of employees * Number of employees Total expense = Salary expense + other expense
Find the total average salary of employees in all the given years together?
Rs. 59000
Rs. 48000
Rs. 53000
Rs. 56000
Step by step video & image solution for Study the following information carefully and answer the given questions: In the year 2015, the salary expense of a company is 16 lakhs and the total number of employees is 80 and in the year 2016, the average salary of employees is Rs. 4000 more than the previous year. The salary expense in 2016 is 20% more than the previous year. Theother expense in the year 2016 is 34 lakhs. The total expense in the year 2015 and 2016 is same. In the year 2017, the number of employees is 5 less than the previous year. The average salary of employees in the year 2017 is Rs. 15000 and the other expense in the year 2017 is Rs. 47.75 lakhs. Note: Salary expense = Average salary of employees * Number of employees Total expense = Salary expense + other expense Find the total average salary of employees in all the given years together? by Maths experts to help you in doubts & scoring excellent marks in Class 14 exams.
Updated on:21/07/2023Similar Questions
Previous Year Paper 2016-Delhi
View Solution2018 में अमित का वेतन ₹ 126500 है। वर्ष 2016 से उसका वेतन प्रतिवर्ष क्रमश: 10% व 15% बढ़कर 2018 के वेतन तक पहुँच गया। वर्ष 2016 में उसका वेतन कितना था?
View SolutionExpenditure of the company in the year 2017 is what percent less than the average revenue (per annum) in the years 2014, 2015 and 2016?
View SolutionA company employee gets a salary of ₹ 440 which is 10% more than his previous year salary. What was his salary last year?
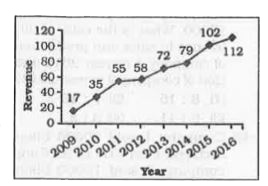
View SolutionThe line chart given below shows the revenue of a company (in lac rupees) from year 2009 to 2016.

In how many years from 2010 to 2016 the increase in the revenue is more than 20% of the previous year value?
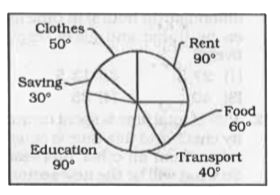
View SolutionThe following pie chart shows the distribution of expenses (in degrees) of a family during 2016. Total income of the family in 2016 = Rs. 1080000

Income of family in the year 2015 was 20% less than that in the year 2016 and the ratio of their savings in 2015 and 2016 is 2:5. Approximately what percentage they saved in the year 2015?
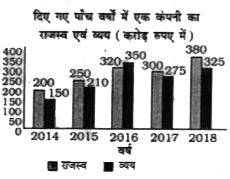
View Solutionनिम्न दण्ड आरेख का अध्ययन कीजिए

कंपनी का वर्ष 2015 एवं 2016 में कुल व्यय तथा वर्ष 2016 एवं 2018 में उसके कुल राजस्व का अनुपात क्या है ?
View SolutionStudy the following bar diagram What is the ratio of the total expenditure of the company in the year 2015 and 2016 to its total revenue in the year 2016 and 2018?
View Solution
