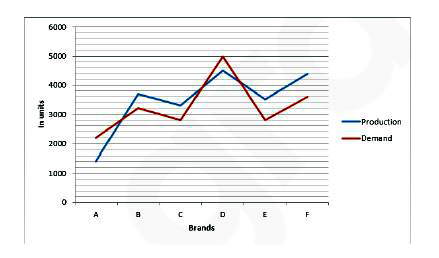
Study the following graph carefully to answer the question given below:
Given below is the demand and production of 6 brands (in units) of a product in the year 2016.

Brand A increase its production to meet its demand. With every 160 unit produced the brand increases its price by 10%. If the earlier price of one product was INR 5000 then find the new price of the product.
INR 5500
INR 6655
INR 7320.5
INR 8052.55
Step by step video & image solution for Study the following graph carefully to answer the question given below: Given below is the demand and production of 6 brands (in units) of a product in the year 2016. Brand A increase its production to meet its demand. With every 160 unit produced the brand increases its price by 10%. If the earlier price of one product was INR 5000 then find the new price of the product. by Maths experts to help you in doubts & scoring excellent marks in Class 14 exams.
Updated on:21/07/2023Similar Questions
Find the perimeter of the figure given below.

View SolutionFind the area of the figure given below.

View SolutionThe area of the shaded part in the figure given below is ______.

View SolutionThe inequation represented by the graph given below is :
View SolutionThe inequation that best describes the graph given below is _________
View SolutionThe inequation that best describes the following graph is _________
View SolutionWrite the vector →F in terms of its component :-
ltimg src="https://d10lpgp6xz60nq.cloudfront.net/physics_images/ALN_PHY_R02_E02_002_Q01.png" width="80%"gt
View SolutionStudy the following graph carefully to answer the question given below: Given below is the demand and production of 6 brands (in units) of a product in the year 2016. If the demand for brand C product increase by 75% then to meet the demand production should be increased by what percent?
View Solution
