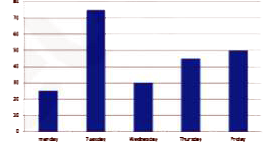
Bar graph given below shows pens sold by a retailor on five different days. Study the data carefully and answer the following questions.
Pen sold on different days

Out of the total pens sold on Thursday,20% are blue ink pen. Out of remaining 25% are red ink pen and remaining are black in pen. Find total no. of blue and black ink pen sold on Thursday?
36
46
56
66
Step by step video & image solution for Bar graph given below shows pens sold by a retailor on five different days. Study the data carefully and answer the following questions. Pen sold on different days Out of the total pens sold on Thursday,20% are blue ink pen. Out of remaining 25% are red ink pen and remaining are black in pen. Find total no. of blue and black ink pen sold on Thursday? by Maths experts to help you in doubts & scoring excellent marks in Class 14 exams.
Updated on:21/07/2023Similar Questions
Out of the total pens, 10% of pens are black. 10% of remaining pens are blue. 20% of remaining pens are red. The remaining 648 pens are green. How many total pens are there?
View SolutionBar graph given below shows pens sold by a retailor on five different days. Study the data carefully and answer the following questions. Pen sold on different days Out of total pens sold on Tuesday ratio between total defective pens sold to total pens sold is 7: 15. Find total number of non - defective pens sold on Tuesday by retailer?
View SolutionBar graph given below shows pens sold by a retailor on five different days. Study the data carefully and answer the following questions. Pen sold on different days Total number of pens sold on Saturday is 40% more than total number of pens sold on Wednesday. Find total number of pens sold on Friday and Saturday together?
View SolutionBar graph given below shows pens sold by a retailor on five different days. Study the data carefully and answer the following questions. Pen sold on different days Find the difference between total number of pens sold on Monday and Tuesday together to total number of pens sold on Thursday and Friday together?
View SolutionBar graph given below shows pens sold by a retailor on five different days. Study the data carefully and answer the following questions. Pen sold on different days Total number of pens sold on Tuesday is 25% more than total number of pens sold on Sunday. Find total of pens sold on Sunday?
View SolutionIn a box there are 5 black pens,3 white pens and 4 red pens .In how many pens can 2 black pens , 2 white pens and 2 red pens can be chosen ?
View SolutionDirection: The given bar graph shows the number of pens sold by two shops A & B in four consecutive months. Study the following data and answer the following questions: Find the ratio of the number of pens sold by shop A in months 1st and 3rd together to the number of pens sold by shop B in months 2nd and 4th together.
View Solution
