Study the given information carefully and answer the questions that follow.
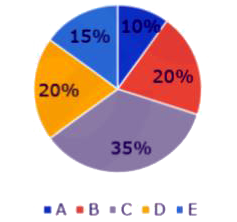
The given below graph shows the percentage distribution of the number of cakes baked by 5 shops (A, B, C, D and E) on a given day. Total number of cakes baked by the 5 shops were 400.

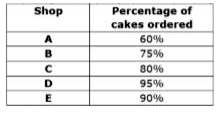
The given below table shows the percentage of cakes ordered from the five shops out of the baked cakes.

Note:
Number of cakes unsold = Number of cakes baked - Number of cakes ordered
All the ordered cakes are to be considered as cakes sold.
The number of cakes that were unsold from shops A, B and C, 25 % were given to the beggars. Of the remaining, 25 % were eaten by the staff of the shops while the rest were sold the next day at 10% loss. If, each cake costed Rs. 250 to bake for all the shops, what was the total amount earned from these cakes?
Rs. 7800
Rs. 8400
Rs. 9450
Rs. 8100
The correct Answer is:D
Step by step video, text & image solution for Study the given information carefully and answer the questions that follow. The given below graph shows the percentage distribution of the number of cakes baked by 5 shops (A, B, C, D and E) on a given day. Total number of cakes baked by the 5 shops were 400. The given below table shows the percentage of cakes ordered from the five shops out of the baked cakes. Note: Number of cakes unsold = Number of cakes baked - Number of cakes ordered All the ordered cakes are to be considered as cakes sold. The number of cakes that were unsold from shops A, B and C, 25 % were given to the beggars. Of the remaining, 25 % were eaten by the staff of the shops while the rest were sold the next day at 10% loss. If, each cake costed Rs. 250 to bake for all the shops, what was the total amount earned from these cakes? by Maths experts to help you in doubts & scoring excellent marks in Class 14 exams.
Updated on:21/07/2023Similar Questions
The inequation that best describes the following graph is _________
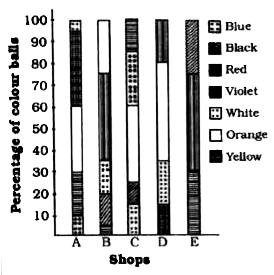
View SolutionIn the following questions, the followIng Bar Diagram shows the percentage of 7 coloured balls sold in 5 shops A, B, C, D and E. Study the graph and answer. all the questions.

The shops having equal percentage of white balls are :
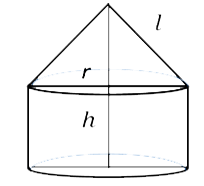
View SolutionThe total surface area of the given solid figure is _______________.

View SolutionIdentify A,B,C and D,E
View SolutionStudy the given information carefully and answer the questions that follow. The given below graph shows the percentage distribution of the number of cakes baked by 5 shops (A, B, C, D and E) on a given day. Total number of cakes baked by the 5 shops were 400. The given below table shows the percentage of cakes ordered from the five shops out of the baked cakes. Note: Number of cakes unsold = Number of cakes baked - Number of cakes ordered All the ordered cakes are to be considered as cakes sold. The number of cakes unsold from shop E is what percentage more than the number of cakes unsold from shop D?
View SolutionStudy the given information carefully and answer the questions that follow. The given below graph shows the percentage distribution of the number of cakes baked by 5 shops (A, B, C, D and E) on a given day. Total number of cakes baked by the 5 shops were 400. The given below table shows the percentage of cakes ordered from the five shops out of the baked cakes. Note: Number of cakes unsold = Number of cakes baked - Number of cakes ordered All the ordered cakes are to be considered as cakes sold. If the total number of cakes baked by all shops is distributed in a degree pie-chart, what would have been the central angle for shop C?
View SolutionStudy the given information carefully and answer the questions that follow. The given below graph shows the percentage distribution of the number of cakes baked by 5 shops (A, B, C, D and E) on a given day. Total number of cakes baked by the 5 shops were 400. The given below table shows the percentage of cakes ordered from the five shops out of the baked cakes. Note: Number of cakes unsold = Number of cakes baked - Number of cakes ordered All the ordered cakes are to be considered as cakes sold. The cost of baking each cake for shop D was Rs. 200. If 25 % of the cakes sold were sold for Rs. 175 and the remaining were sold for Rs. 250. If no revenue is generated from unsold cakes, what will be teh total profit percentage for shop D?
View SolutionStudy the given information carefully and answer the questions that follow. The given below graph shows the percentage distribution of the number of cakes baked by 5 shops (A, B, C, D and E) on a given day. Total number of cakes baked by the 5 shops were 400. The given below table shows the percentage of cakes ordered from the five shops out of the baked cakes. Note: Number of cakes unsold = Number of cakes baked - Number of cakes ordered All the ordered cakes are to be considered as cakes sold. What is the ratio of the number of cakes baked by shop C and the number of cakes sold by shop B?
View Solution
